
Compare Tatva Chintan with Similar Stocks
Stock DNA
Specialty Chemicals
INR 2,819 Cr (Small Cap)
66.00
43
0.08%
0.14
5.38%
3.54
Total Returns (Price + Dividend) 
Latest dividend: 1 per share ex-dividend date: Sep-12-2025
Risk Adjusted Returns v/s
Returns Beta

News
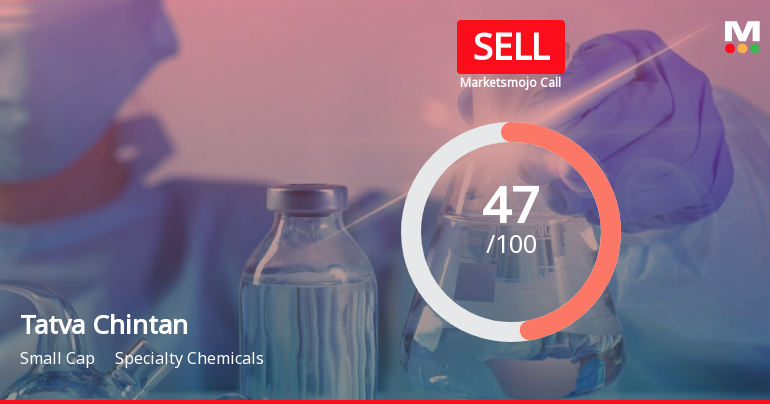
Tatva Chintan Pharma Chem Ltd is Rated Sell
Tatva Chintan Pharma Chem Ltd is rated Sell by MarketsMOJO. This rating was last updated on 21 May 2026, reflecting a change from the previous Hold rating. However, all fundamentals, returns, and financial metrics discussed here are current as of 24 June 2026, providing investors with the latest comprehensive view of the stock’s position.
Read full news article
Tatva Chintan Pharma Chem Ltd is Rated Sell
Tatva Chintan Pharma Chem Ltd is rated 'Sell' by MarketsMOJO, with this rating last updated on 21 May 2026. However, the analysis and financial metrics discussed here reflect the stock’s current position as of 13 June 2026, providing investors with the latest insights into the company’s fundamentals, valuation, financial trends, and technical outlook.
Read full news article
Tatva Chintan Pharma Chem Ltd is Rated Sell
Tatva Chintan Pharma Chem Ltd is rated 'Sell' by MarketsMOJO, with this rating last updated on 21 May 2026. However, the analysis and financial metrics discussed here reflect the stock's current position as of 02 June 2026, providing investors with the latest insights into the company’s performance and outlook.
Read full news article Announcements
Announcement under Regulation 30 (LODR)-Analyst / Investor Meet - Intimation
12-Jun-2026 | Source : BSEIntimation of Schedule of Analyst / Institutional Investor Meeting under the SEBI (Listing Obligations and Disclosure Requirements) Regulations 2015.
Announcement under Regulation 30 (LODR)-Earnings Call Transcript
19-May-2026 | Source : BSETranscript of the earnings call held on 16 May 2026 post announcement of the financial results of the Company for the quarter and financial year ended 31 March 2026.
Compliances-Reg.24(A)-Annual Secretarial Compliance
18-May-2026 | Source : BSESubmission of Annual Secretarial Compliance Report for the financial year ended 31 March 2026 (2025-2026).
Corporate Actions

No Upcoming Board Meetings

Tatva Chintan Pharma Chem Ltd has declared 10% dividend, ex-date: 12 Sep 25

No Splits history available

No Bonus history available

No Rights history available
Quality key factors
Valuation key factors
Technicals key factors
 Technical Indicator Scale: Bearish, Mildly Bearish, Sideways, Mildly Bullish, Bullish Turned
 Shareholding Snapshot : Mar 2026
Shareholding Compare (%holding)
Promoters
None
Held by 4 Schemes (2.87%)
Held by 32 FIIs (3.82%)
Shekhar Rasiklal Somani (23.07%)
Goldman Sachs Funds - Goldman Sachs India Equity Portfolio (2.59%)
18.32%
Quarterly Results Snapshot (Consolidated) - Mar'26 - QoQ

QoQ Growth in quarter ended Mar 2026 is 2.14% vs 6.32% in Dec 2025
QoQ Growth in quarter ended Mar 2026 is -31.97% vs 52.92% in Dec 2025
Half Yearly Results Snapshot (Consolidated) - Sep'25

Growth in half year ended Sep 2025 is 27.22% vs -10.46% in Sep 2024
Growth in half year ended Sep 2025 is 264.18% vs -73.68% in Sep 2024
Nine Monthly Results Snapshot (Consolidated) - Dec'25
YoY Growth in nine months ended Dec 2025 is 35.24% vs -6.91% in Dec 2024
YoY Growth in nine months ended Dec 2025 is 576.76% vs -77.40% in Dec 2024
Annual Results Snapshot (Consolidated) - Mar'26
YoY Growth in year ended Mar 2026 is 32.18% vs -2.74% in Mar 2025
YoY Growth in year ended Mar 2026 is 636.43% vs -81.19% in Mar 2025
About Tatva Chintan Pharma Chem Ltd

Company Coordinates


