
Compare Anand Rathi Wea. with Similar Stocks
Dashboard
Strong Long Term Fundamental Strength with an average Return on Equity (ROE) of 38.69%
Healthy long term growth as Operating profit has grown by an annual rate of 34.30%
Flat results in Mar 26
With ROE of 39.7, it has a Very Expensive valuation with a 31.6 Price to Book Value
Increasing Participation by Institutional Investors
Consistent Returns over the last 3 years
Stock DNA
Capital Markets
INR 31,269 Cr (Small Cap)
80.00
21
0.34%
0.08
39.65%
31.64
Total Returns (Price + Dividend) 
Latest dividend: 3.485173611111111 per share ex-dividend date: May-15-2026
Risk Adjusted Returns v/s
Returns Beta

News

Anand Rathi Wealth Ltd is Rated Hold by MarketsMOJO
Anand Rathi Wealth Ltd is rated 'Hold' by MarketsMOJO, with this rating last updated on 09 April 2026. However, the analysis and financial metrics presented here reflect the stock’s current position as of 23 June 2026, providing investors with an up-to-date view of the company’s fundamentals, returns, and market standing.
Read full news article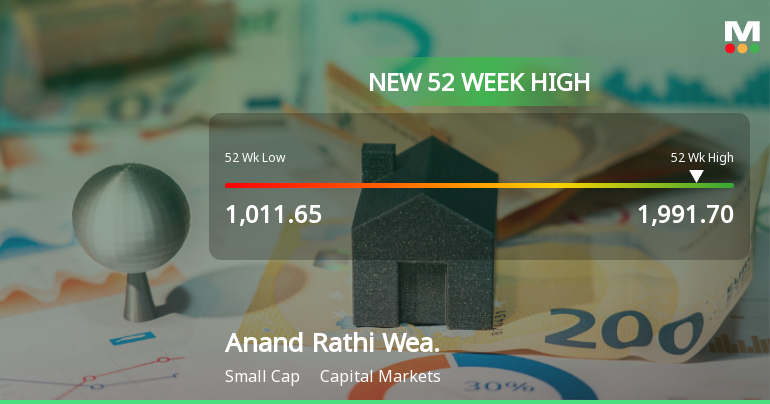
Broad-Based Technical Strength Lifts Anand Rathi Wealth Ltd to 52-Week High of Rs 1952.65
With a sustained rally that has lifted it close to its 52-week peak, Anand Rathi Wealth Ltd has demonstrated remarkable price momentum, outperforming its sector and the broader market over recent sessions.
Read full news article
Anand Rathi Wealth Ltd Technical Momentum Shifts Signal Bullish Outlook
Anand Rathi Wealth Ltd has experienced a notable shift in its technical momentum, moving from a mildly bullish stance to a more confident bullish trend. This change is underscored by a combination of moving averages, Bollinger Bands, and momentum oscillators, suggesting a strengthening price momentum despite mixed signals from some weekly indicators.
Read full news article Announcements
Announcement under Regulation 30 (LODR)-Change in Management
15-Jun-2026 | Source : BSEAppointment of Mr. Chintak Shah as Head -NRI
Disclosures under Reg. 31(1) and 31(2) of SEBI (SAST) Regulations 2011.
10-Jun-2026 | Source : BSEThe Exchange has received Disclosure under Regulation 31(1) and 31(2) of SEBI (Substantial Acquisition of Shares & Takeovers) Regulations 2011 on June 10 2026 for Anand Rathi Financial Services Ltd
Revised Disclosures of reasons for encumbrance by promoter of listed companies under Reg. 31(1) read with Regulation 28(3) of SEBI (SAST) Regulations 2011.
10-Jun-2026 | Source : BSEThe Exchange has received the revised Disclosures of reasons for encumbrance by promoter of listed companies under Reg. 31(1) read with Regulation 28(3) of SEBI (SAST) Regulations 2011 on June 09 2026 for Anand Rathi Financial Services Ltd
Corporate Actions

No Upcoming Board Meetings

Anand Rathi Wealth Ltd has declared 140% dividend, ex-date: 15 May 26

No Splits history available

Anand Rathi Wealth Ltd has announced 1:1 bonus issue, ex-date: 03 Jun 26

No Rights history available
Quality key factors
Valuation key factors
Technicals key factors
 Technical Indicator Scale: Bearish, Mildly Bearish, Sideways, Mildly Bullish, Bullish Turned
 Shareholding Snapshot : Jun 2026
Shareholding Compare (%holding)
Non Institution
13.8263
Held by 27 Schemes (8.93%)
Held by 132 FIIs (6.78%)
Anand Rathi Financial Services Limited (18.17%)
Quant Mutual Fund - Quant Small Cap Fund (2.86%)
32.51%
Quarterly Results Snapshot (Consolidated) - Mar'26 - QoQ

QoQ Growth in quarter ended Mar 2026 is -0.62% vs -2.61% in Dec 2025
QoQ Growth in quarter ended Mar 2026 is 3.24% vs 0.50% in Dec 2025
Half Yearly Results Snapshot (Consolidated) - Sep'25

Growth in half year ended Sep 2025 is 19.01% vs 34.25% in Sep 2024
Growth in half year ended Sep 2025 is 29.21% vs 35.10% in Sep 2024
Nine Monthly Results Snapshot (Consolidated) - Dec'25
YoY Growth in nine months ended Dec 2025 is 20.06% vs 32.79% in Dec 2024
YoY Growth in nine months ended Dec 2025 is 29.35% vs 34.45% in Dec 2024
Annual Results Snapshot (Consolidated) - Mar'26
YoY Growth in year ended Mar 2026 is 22.33% vs 29.65% in Mar 2025
YoY Growth in year ended Mar 2026 is 32.04% vs 33.28% in Mar 2025
About Anand Rathi Wealth Ltd

Company Coordinates


