
Compare Virtuoso Optoel. with Similar Stocks
Dashboard
Healthy long term growth as Net Sales has grown by an annual rate of 42.90%
Flat results in Mar 26
With ROCE of 7.5, it has a Expensive valuation with a 2.3 Enterprise value to Capital Employed
Increasing Participation by Institutional Investors
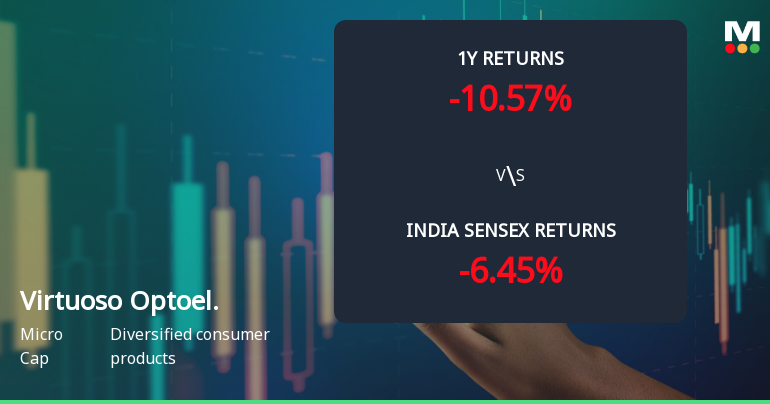
Underperformed the market in the last 1 year
Stock DNA
Diversified consumer products
INR 1,362 Cr (Micro Cap)
88.00
58
0.00%
0.81
3.90%
3.27
Total Returns (Price + Dividend) 
Virtuoso Optoel. for the last several years.
Risk Adjusted Returns v/s
Returns Beta

News
Virtuoso Optoelectronics Ltd Sees Technical Momentum Shift Amid Mixed Indicator Signals
Virtuoso Optoelectronics Ltd, a micro-cap player in the diversified consumer products sector, has experienced a notable shift in its technical momentum, moving from a sideways trend to a mildly bullish stance. This change is underscored by a complex interplay of technical indicators, including MACD, RSI, Bollinger Bands, and moving averages, which collectively paint a nuanced picture of the stock’s near-term prospects.
Read full news article
Virtuoso Optoelectronics Ltd Sees Mixed Technical Signals Amid Price Momentum Shift
Virtuoso Optoelectronics Ltd, a micro-cap player in the diversified consumer products sector, has exhibited a notable shift in price momentum and technical indicators, signalling a transition from a mildly bearish trend to a sideways movement. The stock’s recent 4.99% intraday gain to ₹388.25, coupled with mixed technical signals across weekly and monthly charts, presents a complex picture for investors assessing its near-term trajectory.
Read full news article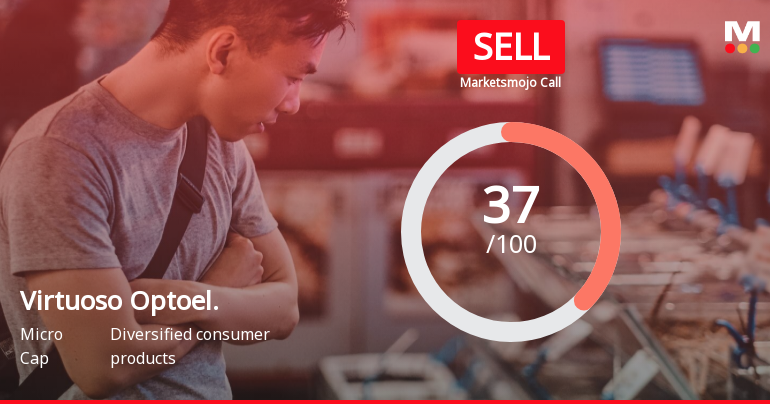
Virtuoso Optoelectronics Ltd is Rated Sell
Virtuoso Optoelectronics Ltd is rated Sell by MarketsMOJO, with this rating last updated on 01 June 2026. However, the analysis and financial metrics discussed here reflect the stock’s current position as of 13 June 2026, providing investors with the most up-to-date view of the company’s fundamentals, returns, and market performance.
Read full news article Announcements
Announcement under Regulation 30 (LODR)-Newspaper Publication
21-Jun-2026 | Source : BSEEOGM Newspaper Publication
Shareholders Meeting July 12 2026
20-Jun-2026 | Source : BSENotice of Shareholders Meeting on July 12 2026
Board Meeting Outcome for Outcome Of Board Meeting
20-Jun-2026 | Source : BSEBoard has approved 1. Offer issue and allot on preferential basis equity shares and unlisted fully convertible warrants 2. Date and Notice of EOGM 3. Appointment of scrutinizer
Corporate Actions

No Upcoming Board Meetings

No Dividend history available

No Splits history available

No Bonus history available

No Rights history available
Quality key factors
Valuation key factors
Technicals key factors
 Technical Indicator Scale: Bearish, Mildly Bearish, Sideways, Mildly Bullish, Bullish Turned
 Shareholding Snapshot : Mar 2026
Shareholding Compare (%holding)
Promoters
None
Held by 0 Schemes
Held by 3 FIIs (11.14%)
Sukrit Arvind Bharati (47.93%)
Malabar India Fund Limited (7.91%)
29.18%
Quarterly Results Snapshot (Standalone) - Mar'26 - QoQ

QoQ Growth in quarter ended Mar 2026 is 61.97% vs 110.72% in Dec 2025
QoQ Growth in quarter ended Mar 2026 is -22.41% vs 312.99% in Dec 2025
Half Yearly Results Snapshot (Consolidated) - Sep'25
Growth in half year ended Sep 2025 is -22.43% vs 27.13% in Mar 2025
Growth in half year ended Sep 2025 is -53.90% vs -26.14% in Mar 2025
Nine Monthly Results Snapshot (Consolidated) - Dec'25
YoY Growth in nine months ended Dec 2025 is -18.53% vs 12.03% in Mar 2026
YoY Growth in nine months ended Dec 2025 is -11.25% vs 49.81% in Mar 2026
Annual Results Snapshot (Consolidated) - Mar'26
YoY Growth in year ended Mar 2026 is 17.83% vs 31.62% in Mar 2025

YoY Growth in year ended Mar 2026 is 22.39% vs 20.75% in Mar 2025
About Virtuoso Optoelectronics Ltd

Company Coordinates


