
Compare Tracxn Technolo. with Similar Stocks
Stock DNA
Commercial Services & Supplies
INR 322 Cr (Micro Cap)
NA (Loss Making)
20
0.00%
-1.69
-12.52%
6.18
Total Returns (Price + Dividend) 
Tracxn Technolo. for the last several years.
Risk Adjusted Returns v/s
Returns Beta

News

Tracxn Technologies Ltd is Rated Strong Sell
Tracxn Technologies Ltd is rated Strong Sell by MarketsMOJO, with this rating last updated on 05 February 2026. However, the analysis and financial metrics presented here reflect the company’s current position as of 03 July 2026, providing investors with an up-to-date view of the stock’s fundamentals, returns, and technical outlook.
Read full news article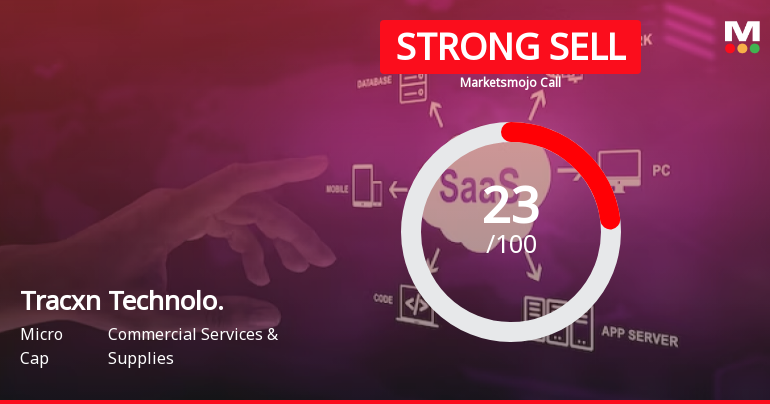
Tracxn Technologies Ltd is Rated Strong Sell
Tracxn Technologies Ltd is rated Strong Sell by MarketsMOJO, with this rating last updated on 05 February 2026. However, the analysis and financial metrics discussed here reflect the stock’s current position as of 22 June 2026, providing investors with an up-to-date view of the company’s fundamentals, returns, and market standing.
Read full news article
Tracxn Technologies Ltd is Rated Strong Sell
Tracxn Technologies Ltd is rated Strong Sell by MarketsMOJO. This rating was last updated on 05 February 2026, reflecting a reassessment of the stock’s outlook. However, the analysis below is based on the company’s current fundamentals, returns, and financial metrics as of 11 June 2026, providing investors with an up-to-date perspective on the stock’s position.
Read full news article Announcements
Closure of Trading Window
25-Jun-2026 | Source : BSEIntmation of Closure of Trading Window
Announcement under Regulation 30 (LODR)-Allotment of ESOP / ESPS
05-Jun-2026 | Source : BSEIntimation for allotment of 94197 Equity Shares under TRACXN Employee Stock Option Plan 2016
Intimation For Grant Of Employee Stock Options Under TRACXN Employee Stock Option Plan 2016
29-May-2026 | Source : BSEEnclosed herewith intimation of grant of option.
Corporate Actions

No Upcoming Board Meetings

No Dividend history available

No Splits history available

No Bonus history available

No Rights history available
Quality key factors
Valuation key factors
Technicals key factors
 Technical Indicator Scale: Bearish, Mildly Bearish, Sideways, Mildly Bullish, Bullish Turned
 Shareholding Snapshot : Mar 2026
Shareholding Compare (%holding)
Non Institution
None
Held by 2 Schemes (1.44%)
Held by 6 FIIs (0.52%)
Abhishek Goyal (17.69%)
Mukul Mahavir Agrawal (1.87%)
48.22%
Quarterly Results Snapshot (Standalone) - Mar'26 - QoQ

QoQ Growth in quarter ended Mar 2026 is -2.61% vs -0.99% in Dec 2025
QoQ Growth in quarter ended Mar 2026 is -224.69% vs 85.43% in Dec 2025
Half Yearly Results Snapshot (Standalone) - Sep'25
Growth in half year ended Sep 2025 is 1.24% vs 1.50% in Sep 2024

Growth in half year ended Sep 2025 is -31.36% vs -218.18% in Sep 2024
Nine Monthly Results Snapshot (Standalone) - Dec'25
YoY Growth in nine months ended Dec 2025 is 0.27% vs 1.39% in Dec 2024
YoY Growth in nine months ended Dec 2025 is -167.86% vs -138.58% in Dec 2024
Annual Results Snapshot (Standalone) - Mar'26
YoY Growth in year ended Mar 2026 is -0.59% vs 2.05% in Mar 2025
YoY Growth in year ended Mar 2026 is 17.30% vs -246.77% in Mar 2025
About Tracxn Technologies Ltd

Company Coordinates


