
Compare Anzen IYEP Trust with Similar Stocks
Dashboard
Poor Management Efficiency with a low ROCE of 2.77%
- The company has been able to generate a Return on Capital Employed (avg) of 2.77% signifying low profitability per unit of total capital (equity and debt)
Low ability to service debt as the company has a high Debt to EBITDA ratio of 4.33 times
Healthy long term growth as Operating profit has grown by an annual rate 104.59%
Flat results in Dec 25
With ROCE of 3.3, it has a Very Expensive valuation with a 1.5 Enterprise value to Capital Employed
Stock DNA
Miscellaneous
INR 3,043 Cr (Small Cap)
NA (Loss Making)
NA
4.06%
1.20
-0.64%
2.10
Total Returns (Price + Dividend) 
Latest dividend: 2.1012 per share ex-dividend date: Feb-03-2026
Risk Adjusted Returns v/s
Returns Beta

News

Anzen India Energy Yield Plus Trust is Rated Hold
Anzen India Energy Yield Plus Trust is rated 'Hold' by MarketsMOJO, with this rating last updated on 06 Mar 2026. However, the analysis and financial metrics discussed here reflect the stock's current position as of 18 March 2026, providing investors with an up-to-date view of its performance and outlook.
Read full news article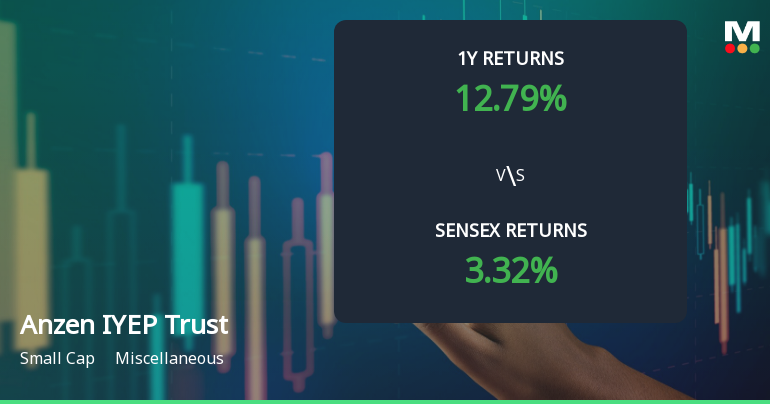
Anzen India Energy Yield Plus Trust Shows Mildly Bullish Momentum Amid Technical Upgrades
Anzen India Energy Yield Plus Trust has recently exhibited a shift in its technical momentum, moving from a non-qualifying stance to a mildly bullish trend. This change is underscored by a combination of moving average signals and nuanced readings from key technical indicators such as MACD, RSI, and Bollinger Bands, suggesting a cautiously optimistic outlook for investors.
Read full news article
Anzen India Energy Yield Plus Trust is Rated Hold
Anzen India Energy Yield Plus Trust is rated 'Hold' by MarketsMOJO, with this rating last updated on 06 March 2026. However, the analysis and financial metrics discussed below reflect the stock's current position as of 07 March 2026, providing investors with an up-to-date view of its fundamentals, returns, and overall outlook.
Read full news article Announcements
Reg 23(5)(i): Disclosure of material issue
16-Mar-2026 | Source : BSEAnzen India Energy Yield Plus Trust has informed the Exchange regarding Disclosure of material issue
Reg 23(5)(i): Disclosure of material issue
02-Mar-2026 | Source : BSEAnzen India Energy Yield Plus Trust has informed the Exchange regarding Disclosure of material issue
Reg 23(5)(i): Disclosure of material issue
28-Feb-2026 | Source : BSEAnzen India Energy Yield Plus Trust has informed the Exchange regarding Disclosure of material issue
Corporate Actions

No Upcoming Board Meetings

Anzen India Energy Yield Plus Trust has declared 2% dividend, ex-date: 03 Feb 26

No Splits history available

No Bonus history available

No Rights history available
Quality key factors
Valuation key factors
Technicals key factors
 Technical Indicator Scale: Bearish, Mildly Bearish, Sideways, Mildly Bullish, Bullish Turned
 Shareholding Snapshot : Feb 2026
Shareholding Compare (%holding)
Non Institution
None
Held by 0 Schemes (0.59%)
Held by 0 FIIs
Edelweiss Infrastructure Yield Plus (11.54%)
Nuvama Multi Asset Strategy Return Fund (0.97%)
15.82%
Quarterly Results Snapshot (Consolidated) - Dec'25 - QoQ

QoQ Growth in quarter ended Dec 2025 is 3.01% vs -8.86% in Sep 2025
QoQ Growth in quarter ended Dec 2025 is 50.81% vs -184.29% in Sep 2025
About Anzen India Energy Yield Plus Trust

Company Coordinates


