
Compare Aeroflex Neu with Similar Stocks
Dashboard
Weak Long Term Fundamental Strength with a -53.89% CAGR growth in Operating Profits over the last 5 years
- Company's ability to service its debt is weak with a poor EBIT to Interest (avg) ratio of 0.97
- The company has been able to generate a Return on Equity (avg) of 0.94% signifying low profitability per unit of shareholders funds
- PAT(Q) At Rs -0.81 cr has Fallen at -246.6% (vs previous 4Q average)
- PBDIT(Q) Lowest at Rs 0.06 cr.
- OPERATING PROFIT TO NET SALES (Q) Lowest at 0.18%
With ROE of 1.7, it has a Expensive valuation with a 2.2 Price to Book Value
Underperformed the market in the last 1 year
Total Returns (Price + Dividend) 
Latest dividend: 0.49984718826405866 per share ex-dividend date: Jul-07-2023
Risk Adjusted Returns v/s
Returns Beta

News

Aeroflex Neu Ltd is Rated Sell by MarketsMOJO
Aeroflex Neu Ltd is rated 'Sell' by MarketsMOJO, with this rating last updated on 03 June 2026. However, the analysis and financial metrics discussed below reflect the stock's current position as of 15 June 2026, providing investors with an up-to-date view of the company’s fundamentals, valuation, financial trends, and technical outlook.
Read full news article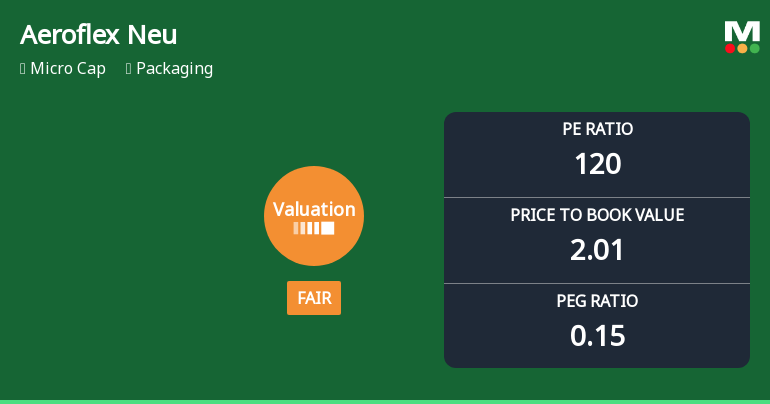
Aeroflex Neu Ltd Valuation Shifts to Fair Amidst Market Volatility
Aeroflex Neu Ltd, a micro-cap player in the packaging sector, has recently undergone a notable shift in its valuation parameters, moving from an expensive to a fair valuation grade. Despite a challenging market environment reflected in its share price decline, the company’s price-to-earnings (P/E) and price-to-book value (P/BV) ratios suggest a recalibration of price attractiveness relative to its historical levels and peer group. This article analyses these valuation changes in detail, placing Aeroflex Neu’s metrics in the context of sector peers and broader market trends.
Read full news article
Aeroflex Neu Ltd Upgraded to Sell on Technical Improvements Despite Weak Fundamentals
Aeroflex Neu Ltd, a micro-cap player in the packaging sector, has seen its investment rating upgraded from Strong Sell to Sell as of 3 June 2026. This change is primarily driven by a shift in technical indicators, even as the company continues to grapple with weak financial fundamentals and valuation concerns. The nuanced upgrade reflects a cautious optimism based on recent market signals, while underlying business challenges remain significant.
Read full news article Announcements
Update On Investment In Equity Shares Of Stilonn Valves And Controls Private Limited.
22-May-2026 | Source : BSEUpdates on Investment in Equity Shares of Stilonn Valves and Controls Private Limited
Compliances-Reg.24(A)-Annual Secretarial Compliance
20-May-2026 | Source : BSEAnnual Secretarial Compliance Report for the year ended March 31 2026
Announcement under Regulation 30 (LODR)-Acquisition
18-May-2026 | Source : BSEThe Board of directors has approved the investment in M/s. Stilonn Valves and Controls Private Limited by way of subscribing 243400 (Two Lakhs Forty Three Thousand Four Hundred) equity shares at a price of Rs. 123.30 Per share aggregating to Rs. 30011220/- (Rupees Three Crore Eleven Thousand Two Hundred and Twenty only) in one or more tranches which is involved in the business of manufacturing and supplying high-precision stainless steel valves and fittings.
Corporate Actions

No Upcoming Board Meetings

Aeroflex Neu Ltd has declared 5% dividend, ex-date: 07 Jul 23

No Splits history available

No Bonus history available

No Rights history available
Quality key factors
Valuation key factors
Technicals key factors
 Technical Indicator Scale: Bearish, Mildly Bearish, Sideways, Mildly Bullish, Bullish Turned
 Shareholding Snapshot : Mar 2026
Shareholding Compare (%holding)
Promoters
None
Held by 0 Schemes
Held by 5 FIIs (4.12%)
Aeroflex Enterprises Limited (55.5%)
Park Continental Private Limited (4.33%)
13.56%
Quarterly Results Snapshot (Consolidated) - Mar'26 - QoQ

QoQ Growth in quarter ended Mar 2026 is 10.30% vs -10.54% in Dec 2025

QoQ Growth in quarter ended Mar 2026 is -218.67% vs -26.47% in Dec 2025
Half Yearly Results Snapshot (Consolidated) - Sep'25
Growth in half year ended Sep 2025 is 1.90% vs 23.98% in Sep 2024
Growth in half year ended Sep 2025 is 232.73% vs -12.70% in Sep 2024
Nine Monthly Results Snapshot (Consolidated) - Dec'25
YoY Growth in nine months ended Dec 2025 is -0.26% vs 24.19% in Dec 2024
YoY Growth in nine months ended Dec 2025 is 360.71% vs -18.84% in Dec 2024
Annual Results Snapshot (Consolidated) - Mar'26
YoY Growth in year ended Mar 2026 is -0.05% vs 18.36% in Mar 2025
YoY Growth in year ended Mar 2026 is 745.00% vs -75.00% in Mar 2025
About Aeroflex Neu Ltd

Company Coordinates


