
Compare Shradha AI Tech with Similar Stocks
Stock DNA
Computers - Software & Consulting
INR 160 Cr (Micro Cap)
17.00
23
2.29%
-0.13
12.34%
2.05
Total Returns (Price + Dividend) 
Latest dividend: 0.6 per share ex-dividend date: Aug-08-2025
Risk Adjusted Returns v/s
Returns Beta

News

Shradha AI Technologies Ltd is Rated Sell
Shradha AI Technologies Ltd is rated 'Sell' by MarketsMOJO, with this rating last updated on 27 May 2026. However, the analysis and financial metrics discussed here reflect the company’s current position as of 06 July 2026, providing investors with an up-to-date view of the stock’s fundamentals, valuation, financial trends, and technical outlook.
Read full news article
Shradha AI Technologies Ltd is Rated Sell
Shradha AI Technologies Ltd is rated 'Sell' by MarketsMOJO, with this rating last updated on 27 May 2026. However, the analysis and financial metrics presented here reflect the stock's current position as of 24 June 2026, providing investors with an up-to-date view of its fundamentals, returns, and overall outlook.
Read full news article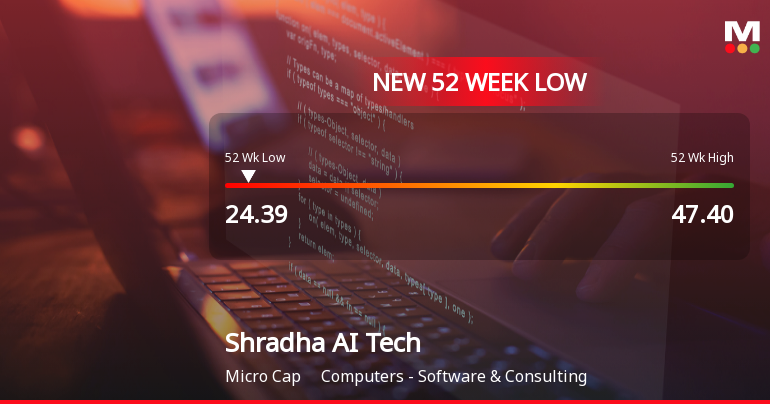
Announcements
Closure of Trading Window
29-Jun-2026 | Source : BSEIntimation for Closure of Trading Window for the quarter ended 30th June 2026
Audited Financial Results Together With Audited Statement Of Assets And Liabilities And Cash Flow Statement Of The Company For The Fourth Quarter (Q-4)/ Half Year (H-2) And Financial Year Ended 31St March 2026 Together With The Report Of Statutory Auditor
26-May-2026 | Source : BSEAudited Financial results for the quarter and year ended 31.03.2026
Board Meeting Outcome for Outcome Of The 01St Meeting Of The Board Of Directors Of The Company Of Financial Year 2026-2027 Held On Tuesday 26Th May 2026
26-May-2026 | Source : BSEOutcome of the 01st Meeting of the Board of Directors of the Company of Financial Year 2026-2027 held on Tuesday 26th May 2026
Corporate Actions

No Upcoming Board Meetings

Shradha AI Technologies Ltd has declared 30% dividend, ex-date: 08 Aug 25

Shradha AI Technologies Ltd has announced 2:5 stock split, ex-date: 10 Dec 24

No Bonus history available

No Rights history available
Quality key factors
Valuation key factors
Technicals key factors
 Technical Indicator Scale: Bearish, Mildly Bearish, Sideways, Mildly Bullish, Bullish Turned
 Shareholding Snapshot : Mar 2026
Shareholding Compare (%holding)
Promoters
None
Held by 0 Schemes
Held by 0 FIIs
Sunil Raisoni (25.13%)
Yola Stays Limited (2.26%)
17.83%
Quarterly Results Snapshot (Standalone) - Mar'26 - QoQ

QoQ Growth in quarter ended Mar 2026 is 73.05% vs -30.47% in Dec 2025
QoQ Growth in quarter ended Mar 2026 is 96.64% vs -46.21% in Dec 2025
Half Yearly Results Snapshot (Standalone) - Sep'25
Growth in half year ended Sep 2025 is 59.54% vs -28.26% in Sep 2024

Growth in half year ended Sep 2025 is 43.56% vs 63.60% in Sep 2024
Nine Monthly Results Snapshot (Standalone) - Dec'25
YoY Growth in nine months ended Dec 2025 is 15.44% vs -11.95% in Dec 2024
YoY Growth in nine months ended Dec 2025 is 1.87% vs 64.40% in Dec 2024
Annual Results Snapshot (Standalone) - Mar'26
YoY Growth in year ended Mar 2026 is 27.52% vs -14.36% in Mar 2025
YoY Growth in year ended Mar 2026 is 8.76% vs 51.80% in Mar 2025
About Shradha AI Technologies Ltd

Company Coordinates


