
Compare Rishabh Instrum. with Similar Stocks
Dashboard
Poor Management Efficiency with a low ROE of 7.31%
- The company has been able to generate a Return on Equity (avg) of 7.31% signifying low profitability per unit of shareholders funds
The company is Net-Debt Free
Poor long term growth as Net Sales has grown by an annual rate of 10.82% and Operating profit at 17.73% over the last 5 years
The company has declared Positive results for the last 4 consecutive quarters
With ROE of 10.9, it has a Expensive valuation with a 3 Price to Book Value
Falling Participation by Institutional Investors
Stock DNA
Other Electrical Equipment
INR 2,271 Cr (Micro Cap)
28.00
48
0.00%
-0.16
10.94%
3.05
Total Returns (Price + Dividend) 
Rishabh Instrum. for the last several years.
Risk Adjusted Returns v/s
Returns Beta

News
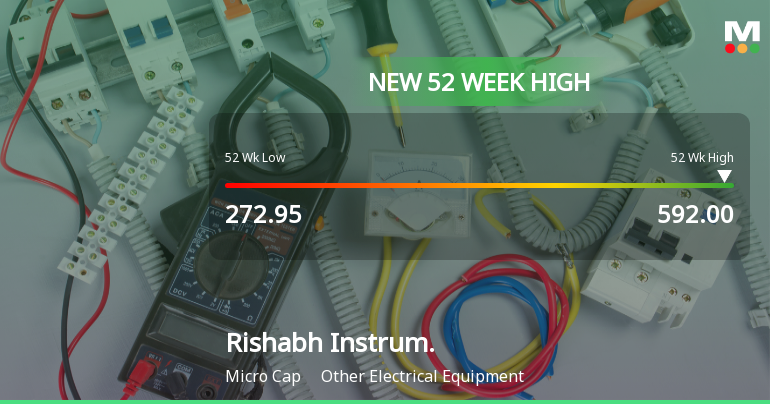
Broad-Based Technical Strength Lifts Rishabh Instruments Ltd to 52-Week High of Rs 592
Surging past its previous peaks, Rishabh Instruments Ltd touched a new 52-week high of Rs 592 on 23 Jun 2026, marking a remarkable 108.7% gain over the past year. This milestone reflects a sustained rally fuelled by strong technical momentum across multiple timeframes.
Read full news article
Broad-Based Technical Strength Lifts Rishabh Instruments Ltd to 52-Week High of Rs 591.95
Surpassing the Rs 590 mark for the first time, Rishabh Instruments Ltd has surged to a new 52-week high of Rs 591.95 on 19 Jun 2026, marking a remarkable 103.01% gain over the past year. This milestone comes amid a backdrop of strong technical momentum, with the stock outperforming its sector and maintaining gains over the last three sessions.
Read full news article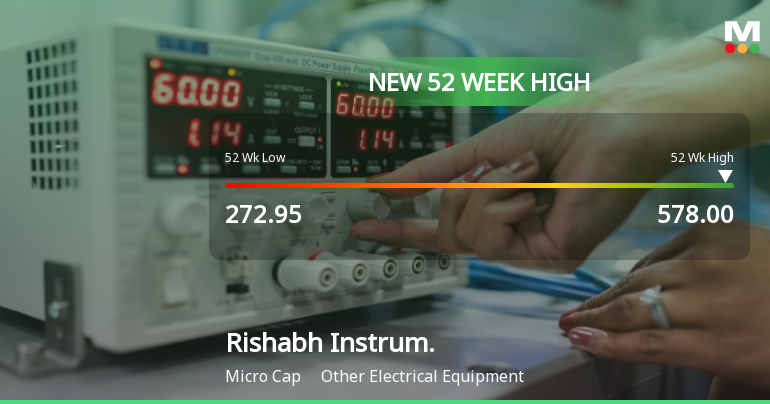
Broad-Based Technical Strength Lifts Rishabh Instruments Ltd to 52-Week High of Rs 578
Surging past its previous peak, Rishabh Instruments Ltd touched a fresh 52-week high of Rs 578 on 18 Jun 2026, marking a remarkable 96.43% gain over the past year. This milestone comes amid a backdrop of strong technical momentum and sustained price strength, setting the stage for a compelling momentum narrative.
Read full news article Announcements
Announcement under Regulation 30 (LODR)-Allotment of ESOP / ESPS
11-Jun-2026 | Source : BSEAs per Attachment
Announcement under Regulation 30 (LODR)-Analyst / Investor Meet - Intimation
08-Jun-2026 | Source : BSEIntimation of Schedule of Analyst / Institutional Investor meetings to be scheduled on June 12 2026 under the SEBI (Listing Obligations and Disclosure Requirements) Regulations 2015
Announcement under Regulation 30 (LODR)-Analyst / Investor Meet - Intimation
08-Jun-2026 | Source : BSEIntimation of Schedule of Analyst / Institutional Investor meetings to be scheduled on June 12 2026 under the SEBI (Listing Obligations and Disclosure Requirements) Regulations 2015
Corporate Actions

No Upcoming Board Meetings

No Dividend history available

No Splits history available

No Bonus history available

No Rights history available
Quality key factors
Valuation key factors
Technicals key factors
 Technical Indicator Scale: Bearish, Mildly Bearish, Sideways, Mildly Bullish, Bullish Turned
 Shareholding Snapshot : Mar 2026
Shareholding Compare (%holding)
Promoters
None
Held by 4 Schemes (10.67%)
Held by 6 FIIs (0.1%)
Narendra Joharimal Goliya Jointly With Asha Narendra Goliya (42.18%)
Quant Mutual Fund - Quant Small Cap Fund (4.92%)
15.37%
Quarterly Results Snapshot (Consolidated) - Mar'26 - QoQ

QoQ Growth in quarter ended Mar 2026 is 11.57% vs -6.47% in Dec 2025
QoQ Growth in quarter ended Mar 2026 is -1.40% vs -9.80% in Dec 2025
Half Yearly Results Snapshot (Consolidated) - Sep'25
Growth in half year ended Sep 2025 is 9.94% vs -0.24% in Sep 2024
Growth in half year ended Sep 2025 is 438.61% vs -73.79% in Sep 2024
Nine Monthly Results Snapshot (Consolidated) - Dec'25
YoY Growth in nine months ended Dec 2025 is 7.02% vs 4.11% in Dec 2024
YoY Growth in nine months ended Dec 2025 is 283.32% vs -56.71% in Dec 2024
Annual Results Snapshot (Consolidated) - Mar'26
YoY Growth in year ended Mar 2026 is 7.61% vs 4.43% in Mar 2025
YoY Growth in year ended Mar 2026 is 263.97% vs -43.52% in Mar 2025
About Rishabh Instruments Ltd

Company Coordinates


