
Compare ASK Automotive with Similar Stocks
Dashboard
High Management Efficiency with a high ROE of 22.56%
Strong ability to service debt as the company has a low Debt to EBITDA ratio of 1.28 times
Healthy long term growth as Operating profit has grown by an annual rate 34.14%
Flat results in Mar 26
With ROCE of 21.1, it has a Very Attractive valuation with a 5 Enterprise value to Capital Employed
Increasing Participation by Institutional Investors
Stock DNA
Auto Components & Equipments
INR 9,259 Cr (Small Cap)
31.00
37
0.32%
0.51
22.68%
6.97
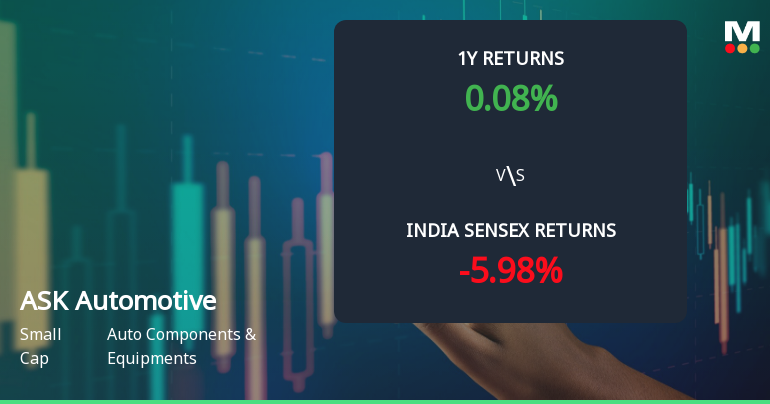
Total Returns (Price + Dividend) 
Latest dividend: 1.5 per share ex-dividend date: Jul-18-2025
Risk Adjusted Returns v/s
Returns Beta

News
ASK Automotive Ltd Sees Technical Momentum Shift Amid Mixed Market Signals
ASK Automotive Ltd has exhibited a notable shift in its technical momentum, moving from a mildly bearish stance to a more sideways trend, reflecting a complex interplay of technical indicators. Despite a strong day gain of 5.20%, the stock’s mixed signals across MACD, RSI, moving averages, and other momentum indicators suggest cautious optimism for investors navigating the auto components sector.
Read full news article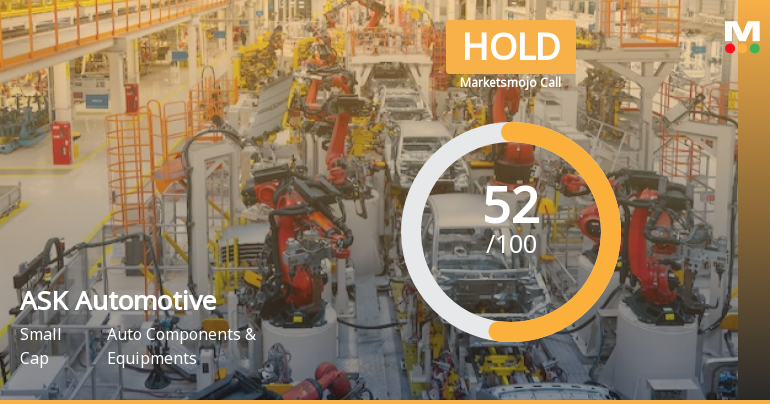
ASK Automotive Ltd is Rated Hold by MarketsMOJO
ASK Automotive Ltd is rated 'Hold' by MarketsMOJO, with this rating last updated on 25 March 2026. However, the analysis and financial metrics discussed here reflect the company’s current position as of 11 June 2026, providing investors with an up-to-date view of the stock’s fundamentals, valuation, financial trends, and technical outlook.
Read full news article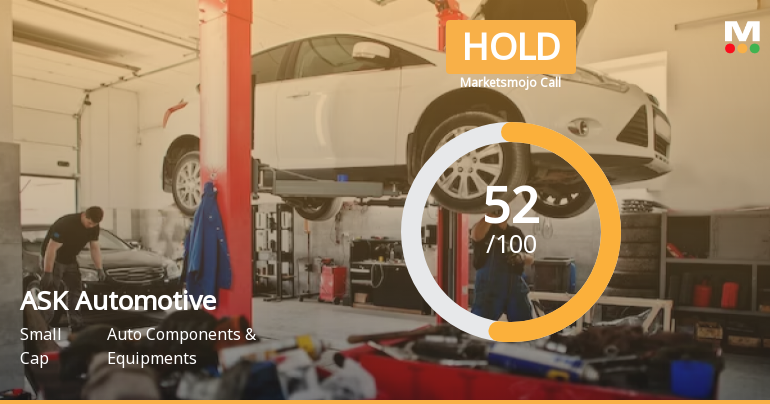
ASK Automotive Ltd is Rated Hold by MarketsMOJO
ASK Automotive Ltd is rated 'Hold' by MarketsMOJO, with this rating last updated on 25 Mar 2026. However, the analysis and financial metrics discussed here reflect the stock's current position as of 31 May 2026, providing investors with an up-to-date view of the company’s performance and prospects.
Read full news article Announcements
Compliances-Reg.24(A)-Annual Secretarial Compliance
26-May-2026 | Source : BSEPlease find enclosed herewith the Annual Secretarial Compliance Report for the financial year ended on March 31 2026 as per Regulation 24A of the SEBI (Listing Obligations and Disclosure Requirements) Regulations 2015.
Announcement under Regulation 30 (LODR)-Earnings Call Transcript
25-May-2026 | Source : BSEPlease find enclosed Transcript of Investor/analysts call organized on May 20 2026 post declaration of Audited Financial Results of the Company for the quarter and financial year ended on March 31 2026
Appointment Of Independent Director In Unlisted Material Subsidiary Company
22-May-2026 | Source : BSEMr. Kumaresh Chandra Misra Independent Director of the Company has been appointed as an Independent Director on the Board of ASK Automobiles Private Limited Unlisted Material Subsidiary Company.
Corporate Actions

No Upcoming Board Meetings

ASK Automotive Ltd has declared 92% dividend, ex-date: 31 Jul 26

No Splits history available

No Bonus history available

No Rights history available
Quality key factors
Valuation key factors
Technicals key factors
 Technical Indicator Scale: Bearish, Mildly Bearish, Sideways, Mildly Bullish, Bullish Turned
 Shareholding Snapshot : Mar 2026
Shareholding Compare (%holding)
Promoters
None
Held by 10 Schemes (6.93%)
Held by 57 FIIs (9.29%)
Vijay Rathee (34.97%)
Sbi Multicap Fund (4.11%)
4.7%
Quarterly Results Snapshot (Consolidated) - Mar'26 - QoQ

QoQ Growth in quarter ended Mar 2026 is 5.80% vs 2.90% in Dec 2025

QoQ Growth in quarter ended Mar 2026 is -10.49% vs 0.15% in Dec 2025
Half Yearly Results Snapshot (Consolidated) - Sep'25
Growth in half year ended Sep 2025 is 5.93% vs 26.59% in Sep 2024
Growth in half year ended Sep 2025 is 17.54% vs 63.17% in Sep 2024
Nine Monthly Results Snapshot (Consolidated) - Dec'25
YoY Growth in nine months ended Dec 2025 is 10.11% vs 24.37% in Dec 2024
YoY Growth in nine months ended Dec 2025 is 18.84% vs 50.79% in Dec 2024
Annual Results Snapshot (Consolidated) - Mar'26
YoY Growth in year ended Mar 2026 is 15.98% vs 20.25% in Mar 2025
YoY Growth in year ended Mar 2026 is 20.07% vs 42.50% in Mar 2025
About ASK Automotive Ltd

Company Coordinates


