
Compare J.G.Chemicals with Similar Stocks
Dashboard
The company is Net-Debt Free
Healthy long term growth as Operating profit has grown by an annual rate 37.22%
Flat results in Mar 26
With ROE of 12.5, it has a Attractive valuation with a 3.1 Price to Book Value
Despite the size of the company, domestic mutual funds hold only 0% of the company
Stock DNA
Commodity Chemicals
INR 1,655 Cr (Small Cap)
25.00
45
0.24%
-0.29
12.47%
3.14
Total Returns (Price + Dividend) 
Latest dividend: 0.998968540484786 per share ex-dividend date: Aug-05-2025
Risk Adjusted Returns v/s
Returns Beta

News
J.G.Chemicals Ltd is Rated Hold by MarketsMOJO
J.G.Chemicals Ltd is rated 'Hold' by MarketsMOJO, with this rating last updated on 08 June 2026. However, the analysis and financial metrics discussed here reflect the stock's current position as of 03 July 2026, providing investors with the most recent insights into the company’s performance and outlook.
Read full news article
J.G.Chemicals Ltd is Rated Hold
J.G.Chemicals Ltd is rated 'Hold' by MarketsMOJO, with this rating last updated on 08 June 2026. However, all fundamentals, returns, and financial metrics discussed here reflect the stock's current position as of 22 June 2026, providing investors with the most up-to-date analysis.
Read full news article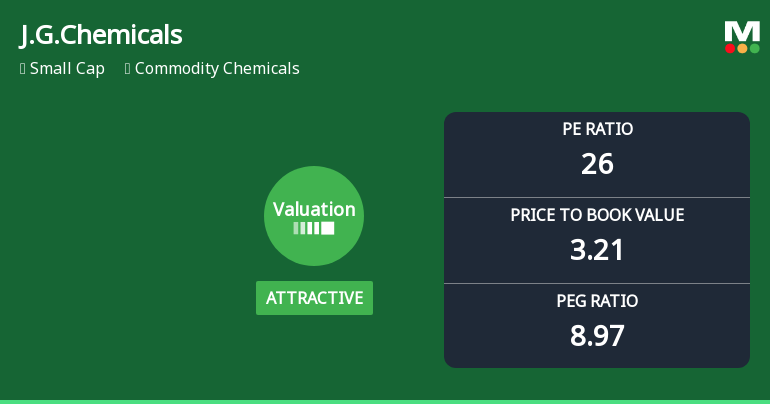
J.G.Chemicals Ltd Valuation Shifts Signal Improved Price Attractiveness
J.G.Chemicals Ltd has witnessed a notable shift in its valuation parameters, moving from a fair to an attractive rating as of early June 2026. This change comes amid a backdrop of elevated valuation multiples across its commodity chemicals sector peers, positioning the small-cap company as a comparatively compelling investment option despite a modest day change of -0.02%.
Read full news article Announcements
Closure of Trading Window
26-Jun-2026 | Source : BSEClosure of Trading Window for the quarter ending 30th June 2026
Announcement under Regulation 30 (LODR)-Analyst / Investor Meet - Intimation
28-May-2026 | Source : BSEIntimation of Schedule of Analyst/Institutional Investors Meeting
Announcement under Regulation 30 (LODR)-Analyst / Investor Meet - Intimation
27-May-2026 | Source : BSEIntimation of Schedule of Analyst/Institutional Investors Meeting
Corporate Actions

No Upcoming Board Meetings

J.G.Chemicals Ltd has declared 10% dividend, ex-date: 05 Aug 25

No Splits history available

No Bonus history available

No Rights history available
Quality key factors
Valuation key factors
Technicals key factors
 Technical Indicator Scale: Bearish, Mildly Bearish, Sideways, Mildly Bullish, Bullish Turned
 Shareholding Snapshot : Mar 2026
Shareholding Compare (%holding)
Promoters
None
Held by 0 Schemes
Held by 9 FIIs (3.28%)
Vision Projects & Finvest Private Limited (21.53%)
Massachusetts Institute Of Technology (2.62%)
17.41%
Quarterly Results Snapshot (Consolidated) - Mar'26 - QoQ

QoQ Growth in quarter ended Mar 2026 is 15.17% vs 12.80% in Dec 2025

QoQ Growth in quarter ended Mar 2026 is 4.06% vs 21.61% in Dec 2025
Half Yearly Results Snapshot (Consolidated) - Sep'25
Growth in half year ended Sep 2025 is 5.71% vs 27.57% in Sep 2024
Growth in half year ended Sep 2025 is -4.83% vs 319.87% in Sep 2024
Nine Monthly Results Snapshot (Consolidated) - Dec'25
YoY Growth in nine months ended Dec 2025 is 10.11% vs 28.24% in Dec 2024
YoY Growth in nine months ended Dec 2025 is -2.05% vs 173.89% in Dec 2024
Annual Results Snapshot (Consolidated) - Mar'26
YoY Growth in year ended Mar 2026 is 14.74% vs 27.00% in Mar 2025
YoY Growth in year ended Mar 2026 is 2.91% vs 107.45% in Mar 2025
About J.G.Chemicals Ltd

Company Coordinates


