
Compare Bharti Hexacom with Similar Stocks
Dashboard
Healthy long term growth as Operating profit has grown by an annual rate 63.68%
The company has declared Positive results for the last 7 consecutive quarters
With ROCE of 21.2, it has a Expensive valuation with a 6.3 Enterprise value to Capital Employed
Majority shareholders : Promoters
Below par performance in long term as well as near term
Stock DNA
Telecom - Services
INR 75,092 Cr (Mid Cap)
42.00
40
0.67%
0.76
24.55%
10.38
Total Returns (Price + Dividend) 
Latest dividend: 10 per share ex-dividend date: Jul-25-2025
Risk Adjusted Returns v/s
Returns Beta

News
Bharti Hexacom Ltd Upgraded to Hold by MarketsMOJO Amid Mixed Financial and Technical Signals
Bharti Hexacom Ltd, a prominent player in the telecom services sector, has seen its investment rating upgraded from Sell to Hold as of 19 June 2026. This change reflects a nuanced improvement across technical indicators, valuation metrics, financial trends, and overall quality assessments, signalling a cautious but more optimistic outlook for investors amid mixed market performance.
Read full news article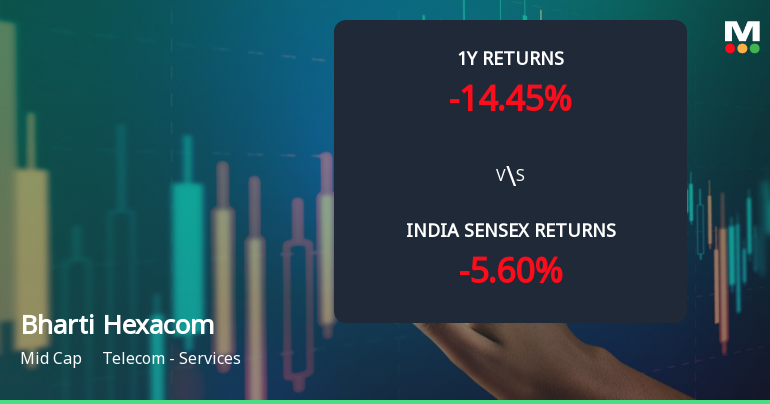
Bharti Hexacom Ltd Technical Momentum Shifts Amid Mixed Market Returns
Bharti Hexacom Ltd, a mid-cap player in the Telecom - Services sector, has witnessed a notable shift in its technical parameters, signalling a mild improvement in price momentum despite lingering bearish undertones. The stock’s recent 3.94% day gain to ₹1,494.15 marks a tentative recovery from its previous close of ₹1,437.55, yet broader technical indicators suggest a complex landscape for investors to navigate.
Read full news article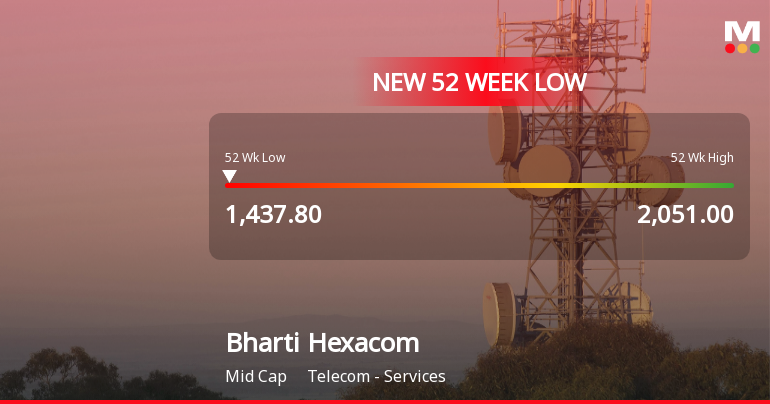
Markets Rally, But Bharti Hexacom Ltd Sinks to 52-Week Low in Stock-Specific Sell-Off
While the broader market edged higher, Bharti Hexacom Ltd slipped to a fresh 52-week low of Rs 1,437 on 18 Jun 2026, marking a 17.63% decline over the past year and underperforming the Sensex by more than 12 percentage points.
Read full news article Announcements
Update On Material Litigation
09-Jun-2026 | Source : BSEDisclosure Under Regulation 30 of SEBI (Listing Obligations and Disclosure Requirements) Regulations 2015- Update on Material Litigation.
Announcement under Regulation 30 (LODR)-Analyst / Investor Meet - Intimation
04-Jun-2026 | Source : BSEDisclosure under Regulation 30 of SEBI (Listing Obligations and Disclosure Requirements) Regulations 2015 (Listing Regulations)
Announcement under Regulation 30 (LODR)-Analyst / Investor Meet - Intimation
26-May-2026 | Source : BSEDisclosure under Regulation 30 of SEBI (Listing Regulations and Disclosure Requirements) Regulations 2015 (Listing Regulations) - Schedule of analysts/ institutional investors meet.
Corporate Actions

No Upcoming Board Meetings

Bharti Hexacom Ltd has declared 200% dividend, ex-date: 25 Jul 25

No Splits history available

No Bonus history available

No Rights history available
Quality key factors
Valuation key factors
Technicals key factors
 Technical Indicator Scale: Bearish, Mildly Bearish, Sideways, Mildly Bullish, Bullish Turned
 Shareholding Snapshot : Mar 2026
Shareholding Compare (%holding)
Promoters
None
Held by 34 Schemes (8.42%)
Held by 138 FIIs (3.69%)
Bharti Airtel Limited (70.0%)
Telecommunications Consultants India Limited (15%)
0.56%
Quarterly Results Snapshot (Standalone) - Mar'26 - QoQ

QoQ Growth in quarter ended Mar 2026 is 2.28% vs 1.83% in Dec 2025

QoQ Growth in quarter ended Mar 2026 is -5.70% vs 12.46% in Dec 2025
Half Yearly Results Snapshot (Standalone) - Sep'25
Growth in half year ended Sep 2025 is 14.27% vs 17.19% in Sep 2024
Growth in half year ended Sep 2025 is 6.35% vs 1,006.08% in Sep 2024
Nine Monthly Results Snapshot (Standalone) - Dec'25
YoY Growth in nine months ended Dec 2025 is 10.88% vs 19.88% in Dec 2024
YoY Growth in nine months ended Dec 2025 is 25.49% vs 263.80% in Dec 2024
Annual Results Snapshot (Standalone) - Mar'26
YoY Growth in year ended Mar 2026 is 9.43% vs 20.58% in Mar 2025
YoY Growth in year ended Mar 2026 is 16.04% vs 196.11% in Mar 2025
About Bharti Hexacom Ltd

Company Coordinates


