
Compare JNK with Similar Stocks
Dashboard
High Management Efficiency with a high ROE of 16.50%
Company has a Debt to Equity ratio (avg) of 0.06 times
With a growth in Net Profit of 87.41%, the company declared Outstanding results in Mar 26
Company is among the highest 1% of companies rated by MarketsMojo across all 4,000 stocks
Market Beating Performance
Stock DNA
Industrial Manufacturing
INR 2,727 Cr (Micro Cap)
41.00
39
0.06%
-0.22
11.44%
4.69
Total Returns (Price + Dividend) 
Latest dividend: 0.3 per share ex-dividend date: Sep-18-2025
Risk Adjusted Returns v/s
Returns Beta

News

JNK India Ltd is Rated Strong Buy
JNK India Ltd is rated 'Strong Buy' by MarketsMOJO, with this rating last updated on 04 June 2026. However, the analysis and financial metrics presented here reflect the company’s current position as of 29 June 2026, providing investors with the latest insights into its performance and outlook.
Read full news article
JNK India Ltd is Rated Strong Buy
JNK India Ltd is rated Strong Buy by MarketsMOJO, with this rating last updated on 04 June 2026. However, the analysis and financial metrics discussed here reflect the company’s current position as of 18 June 2026, providing investors with the most up-to-date insight into the stock’s performance and fundamentals.
Read full news article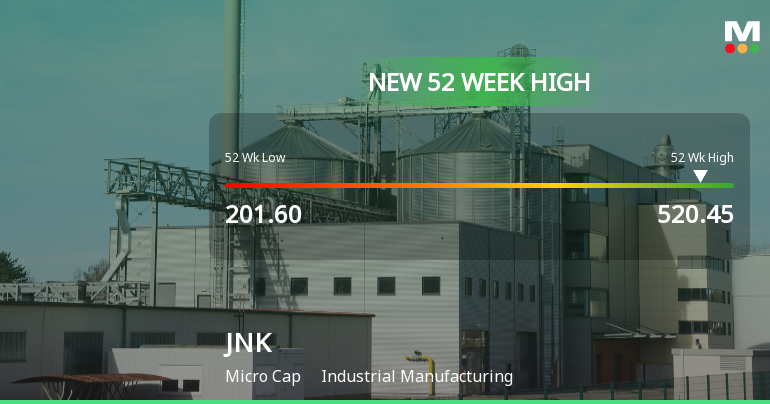
Broad-Based Technical Strength Lifts JNK India Ltd to 52-Week High of Rs 520.45
Surging from a 52-week low of Rs 201.60 to a fresh high of Rs 520.45 on 15 Jun 2026, JNK India Ltd has delivered a remarkable 38.07% return over the past year, significantly outperforming the Sensex’s decline of 5.55%. This milestone reflects a powerful momentum driven by a confluence of technical indicators and sustained price strength.
Read full news article Announcements
Closure of Trading Window
25-Jun-2026 | Source : BSEIntimation of closure of trading window from Wednesday July 1 2026 till the completion of 48 hours after declaration of the Unaudited Financial Results (Standalone & Consolidated) of the Company for the quarter ended June 30 2026.
Announcement under Regulation 30 (LODR)-Award_of_Order_Receipt_of_Order
08-Jun-2026 | Source : BSEIntimation regarding receipt of order
Announcement under Regulation 30 (LODR)-Press Release / Media Release
08-Jun-2026 | Source : BSEJNK India Limited secures Large Export order for Incinerator Package
Corporate Actions

No Upcoming Board Meetings

JNK India Ltd has declared 15% dividend, ex-date: 18 Sep 25

No Splits history available

No Bonus history available

No Rights history available
Quality key factors
Valuation key factors
Technicals key factors
 Technical Indicator Scale: Bearish, Mildly Bearish, Sideways, Mildly Bullish, Bullish Turned
 Shareholding Snapshot : Mar 2026
Shareholding Compare (%holding)
Promoters
None
Held by 5 Schemes (12.52%)
Held by 8 FIIs (1.17%)
Mascot Capital And Marketing Private Limited (32.64%)
Dsp Small Cap Fund (5.45%)
16.58%
Quarterly Results Snapshot (Consolidated) - Mar'26 - QoQ

QoQ Growth in quarter ended Mar 2026 is 67.02% vs 13.60% in Dec 2025
QoQ Growth in quarter ended Mar 2026 is 81.59% vs 36.32% in Dec 2025
Half Yearly Results Snapshot (Consolidated) - Sep'25
Growth in half year ended Sep 2025 is 44.58% vs 43.63% in Sep 2024
Growth in half year ended Sep 2025 is 0.21% vs -12.30% in Sep 2024
Nine Monthly Results Snapshot (Consolidated) - Dec'25
YoY Growth in nine months ended Dec 2025 is 67.99% vs 12.79% in Dec 2024
YoY Growth in nine months ended Dec 2025 is 89.45% vs -63.13% in Dec 2024
Annual Results Snapshot (Consolidated) - Mar'26
YoY Growth in year ended Mar 2026 is 71.73% vs -0.79% in Mar 2025
YoY Growth in year ended Mar 2026 is 115.00% vs -51.78% in Mar 2025
About JNK India Ltd

Company Coordinates


