
Compare Sanstar with Similar Stocks
Dashboard
Weak Long Term Fundamental Strength with a -2.27% CAGR growth in Operating Profits over the last 5 years
- The company has been able to generate a Return on Equity (avg) of 5.80% signifying low profitability per unit of shareholders funds
Positive results in Mar 26
With ROE of 5, it has a Expensive valuation with a 3.2 Price to Book Value
Despite the size of the company, domestic mutual funds hold only 0.03% of the company
Market Beating Performance
Stock DNA
Other Agricultural Products
INR 2,372 Cr (Micro Cap)
64.00
43
0.00%
-0.20
4.96%
3.16
Total Returns (Price + Dividend) 
Sanstar for the last several years.
Risk Adjusted Returns v/s
Returns Beta

News
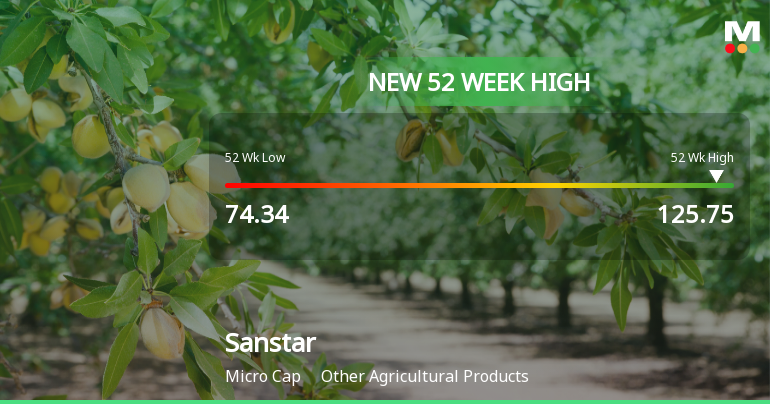
Broad-Based Technical Strength Lifts Sanstar Ltd to 52-Week High of Rs 125.75
Surging to a new 52-week high of Rs 125.75 on 23 Jun 2026, Sanstar Ltd has demonstrated remarkable price momentum, outperforming the broader market with a 39.98% gain over the past year compared to the Sensex’s decline of 5.78%. This milestone caps a sustained rally supported by a confluence of bullish technical indicators across multiple timeframes.
Read full news article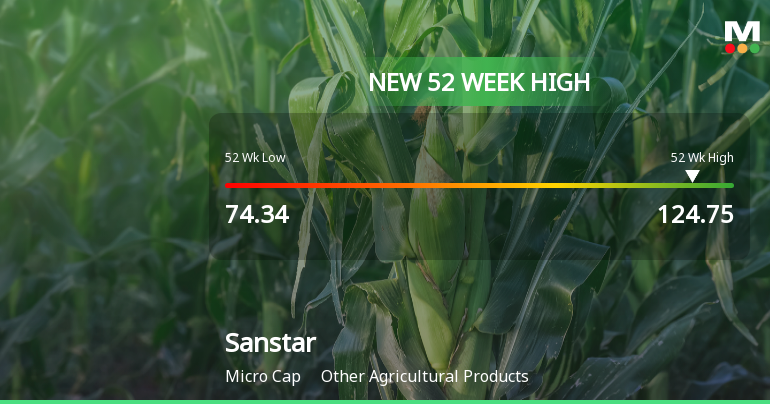
Broad-Based Technical Strength Lifts Sanstar Ltd to 52-Week High of Rs 124.75
With every major moving average breached and a cluster of bullish technical indicators, Sanstar Ltd surged to a fresh 52-week high of Rs 124.75 on 22 Jun 2026, marking a significant milestone in its price momentum.
Read full news article Announcements
Announcement under Regulation 30 (LODR)-Preferential Issue
20-Jun-2026 | Source : BSEPlease find herewith Intimation under Regulation 30 of Preferntial Issue of the Company
Shareholder Meeting / Postal Ballot-Scrutinizers Report
20-Jun-2026 | Source : BSEPlease find herewith Voting Result alongwith the Scrutinizer Report of the Extra Ordinary General Meeting of the Company held today i.e. Saturday 20th June 2026
Announcement under Regulation 30 (LODR)-Issue of Securities
20-Jun-2026 | Source : BSEPlease find herewith Intimation for the Issue of Securities by the Company
Corporate Actions

No Upcoming Board Meetings

No Dividend history available

No Splits history available

No Bonus history available

No Rights history available
Quality key factors
Valuation key factors
Technicals key factors
 Technical Indicator Scale: Bearish, Mildly Bearish, Sideways, Mildly Bullish, Bullish Turned
 Shareholding Snapshot : Mar 2026
Shareholding Compare (%holding)
Promoters
0.0103
Held by 1 Schemes (0.01%)
Held by 5 FIIs (0.02%)
Sambhav Gautamchand Chowdhary (17.61%)
Gagandeep Credit Capital Pvt Ltd (1.73%)
21.53%
Quarterly Results Snapshot (Standalone) - Mar'26 - QoQ

QoQ Growth in quarter ended Mar 2026 is 7.44% vs 2.71% in Dec 2025

QoQ Growth in quarter ended Mar 2026 is 49.89% vs 2,069.84% in Dec 2025
Half Yearly Results Snapshot (Standalone) - Sep'25
Growth in half year ended Sep 2025 is -28.09% vs -8.04% in Sep 2024
Growth in half year ended Sep 2025 is -98.79% vs -16.42% in Sep 2024
Nine Monthly Results Snapshot (Standalone) - Dec'25
YoY Growth in nine months ended Dec 2025 is -22.12% vs -11.39% in Dec 2024
YoY Growth in nine months ended Dec 2025 is -63.53% vs -24.36% in Dec 2024
Annual Results Snapshot (Standalone) - Mar'26
YoY Growth in year ended Mar 2026 is -18.05% vs -13.75% in Mar 2025
YoY Growth in year ended Mar 2026 is -21.33% vs -34.42% in Mar 2025
About Sanstar Ltd

Company Coordinates


