
Compare Kross Ltd with Similar Stocks
Dashboard
The company is Net-Debt Free
Poor long term growth as Net Sales has grown by an annual rate of 11.30% and Operating profit at 14.02% over the last 5 years
Positive results in Mar 26
With ROE of 12.7, it has a Very Attractive valuation with a 2.7 Price to Book Value
Majority shareholders : Promoters
Below par performance in long term as well as near term
Stock DNA
Auto Components & Equipments
INR 1,202 Cr (Micro Cap)
22.00
36
0.00%
-0.12
12.71%
2.71
Total Returns (Price + Dividend) 
Kross Ltd for the last several years.
Risk Adjusted Returns v/s
Returns Beta

News
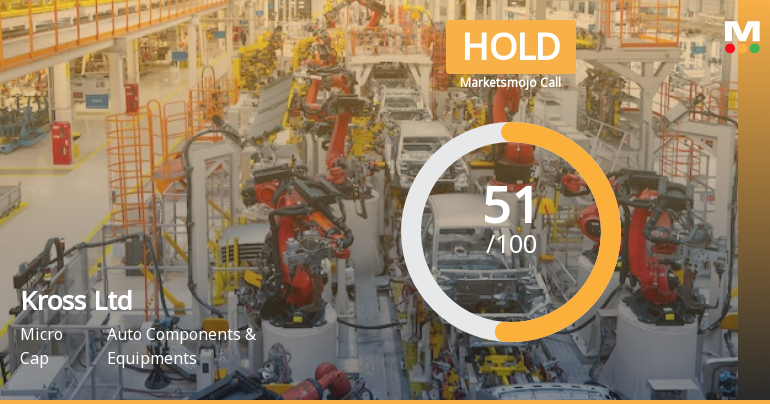
Kross Ltd is Rated Hold by MarketsMOJO
Kross Ltd is rated 'Hold' by MarketsMOJO, with this rating last updated on 08 May 2026. However, the analysis and financial metrics discussed here reflect the stock's current position as of 13 June 2026, providing investors with the latest insights into the company’s performance and outlook.
Read full news article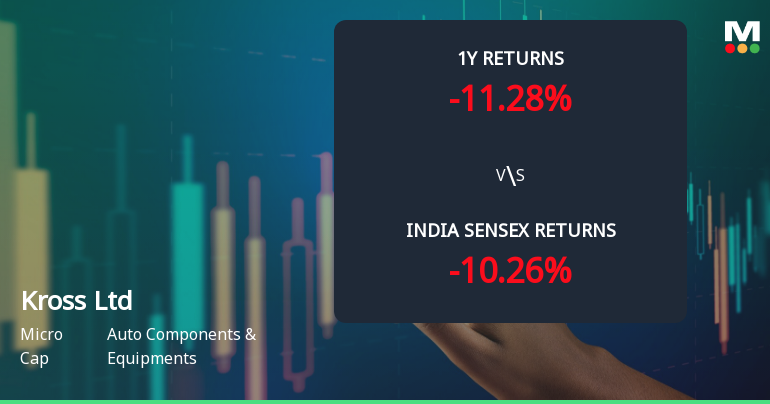
Kross Ltd Technical Momentum Shifts Amid Bearish Signals; Mojo Grade Upgraded to Hold
Kross Ltd, a micro-cap player in the Auto Components & Equipments sector, has experienced a notable shift in its technical momentum, moving from mildly bullish to mildly bearish territory. This transition is underscored by mixed signals from key technical indicators such as MACD, RSI, Bollinger Bands, and moving averages, reflecting a complex market sentiment as the stock price declines sharply over recent sessions.
Read full news article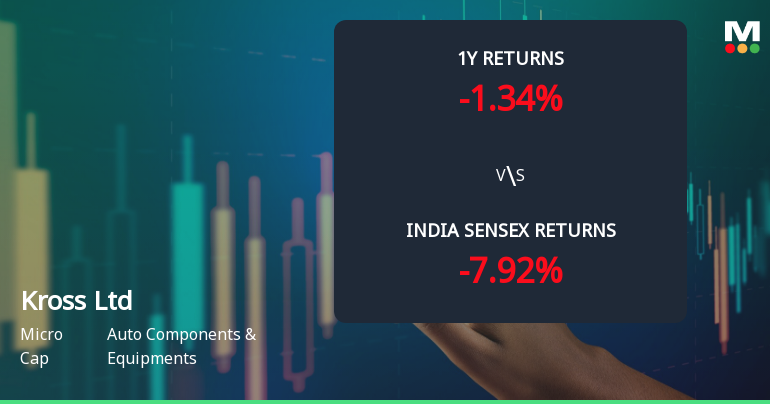
Kross Ltd Technical Momentum Shifts Amid Sideways Trend; Hold Rating Upgraded
Kross Ltd, a micro-cap player in the Auto Components & Equipments sector, has witnessed a notable shift in its technical momentum, prompting an upgrade in its MarketsMOJO rating from Sell to Hold as of 8 May 2026. Despite a modest day decline of 0.65%, the stock’s technical indicators reveal a complex picture of sideways movement and mixed signals, reflecting cautious investor sentiment amid broader market volatility.
Read full news article Announcements
Announcement under Regulation 30 (LODR)-Credit Rating
02-Jun-2026 | Source : BSEIndia Ratings and Research Private Limited has Affirmed Credit Rating for existing bank facilities and Assigned Credit Rating for additional Bank Limits
Announcement under Regulation 30 (LODR)-Analyst / Investor Meet - Outcome
16-May-2026 | Source : BSEThe written transcript of the post earning call with the Analyst/Investor held on Wednesday 13 May 2026 is submitted
Compliances-Reg.24(A)-Annual Secretarial Compliance
14-May-2026 | Source : BSEAnnual Secretarial Complaince report for the Financial Year ended on 31st March 2026 is submitted
Corporate Actions

No Upcoming Board Meetings

No Dividend history available

No Splits history available

No Bonus history available

No Rights history available
Quality key factors
Valuation key factors
Technicals key factors
 Technical Indicator Scale: Bearish, Mildly Bearish, Sideways, Mildly Bullish, Bullish Turned
 Shareholding Snapshot : Mar 2026
Shareholding Compare (%holding)
Promoters
None
Held by 3 Schemes (4.56%)
Held by 11 FIIs (2.62%)
Sudhir Rai (38.19%)
Kotak Mahindra Trustee Co Ltd A/c Kotak Manufactur (1.97%)
19.29%
Quarterly Results Snapshot (Standalone) - Mar'26 - QoQ

QoQ Growth in quarter ended Mar 2026 is 27.03% vs 35.56% in Dec 2025
QoQ Growth in quarter ended Mar 2026 is 60.59% vs 73.02% in Dec 2025
Half Yearly Results Snapshot (Standalone) - Sep'25
Growth in half year ended Sep 2025 is -5.30% vs -1.11% in Sep 2024

Growth in half year ended Sep 2025 is 8.68% vs 3.41% in Sep 2024
Nine Monthly Results Snapshot (Standalone) - Dec'25
YoY Growth in nine months ended Dec 2025 is 2.83% vs -0.40% in Dec 2024
YoY Growth in nine months ended Dec 2025 is 6.09% vs 8.89% in Dec 2024
Annual Results Snapshot (Standalone) - Mar'26
YoY Growth in year ended Mar 2026 is 8.51% vs 0.03% in Mar 2025
YoY Growth in year ended Mar 2026 is 14.95% vs 7.02% in Mar 2025
About Kross Ltd

Company Coordinates


