
Compare Vishal Mega Mart with Similar Stocks
Dashboard
Flat results in Mar 26
- PBT LESS OI(Q) At Rs 200.78 cr has Fallen at -17.6% (vs previous 4Q average)
- PAT(Q) At Rs 167.92 cr has Fallen at -14.6% (vs previous 4Q average)
With ROE of 11.3, it has a Very Expensive valuation with a 7.3 Price to Book Value
Reducing Promoter Confidence
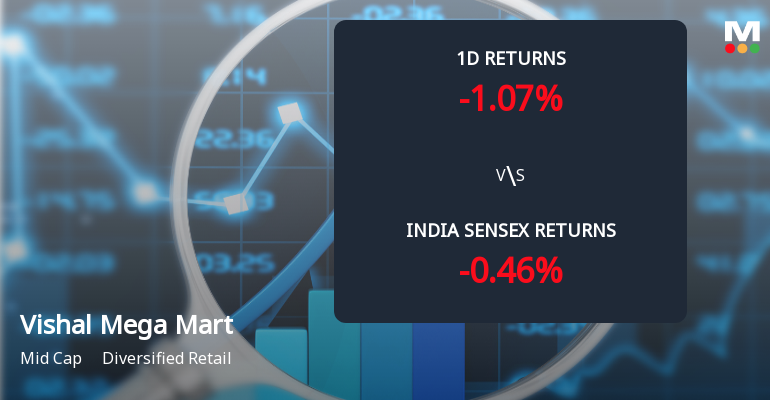
Below par performance in long term as well as near term
Stock DNA
Diversified Retail
INR 54,012 Cr (Mid Cap)
65.00
77
0.00%
0.04
11.32%
7.34
Total Returns (Price + Dividend) 
Vishal Mega Mart for the last several years.
Risk Adjusted Returns v/s
Returns Beta

News
Vishal Mega Mart Sees Significant Open Interest Surge Amid Bearish Momentum
Vishal Mega Mart Ltd (VMM), a mid-cap player in the diversified retail sector, has witnessed a notable 11.6% increase in open interest (OI) in its derivatives segment, signalling heightened market activity despite the stock’s recent underperformance. This surge in OI, coupled with declining prices and volume patterns, suggests a shift in market positioning that may indicate growing bearish sentiment among traders.
Read full news article
Vishal Mega Mart Sees Sharp Open Interest Surge Amid Bearish Momentum
Vishal Mega Mart Ltd (VMM), a mid-cap player in the diversified retail sector, has witnessed a notable 10.48% increase in open interest (OI) in its derivatives segment, signalling heightened market activity and shifting investor positioning. Despite this surge, the stock has underperformed its sector and broader indices, reflecting a complex interplay between bearish price action and rising speculative interest.
Read full news article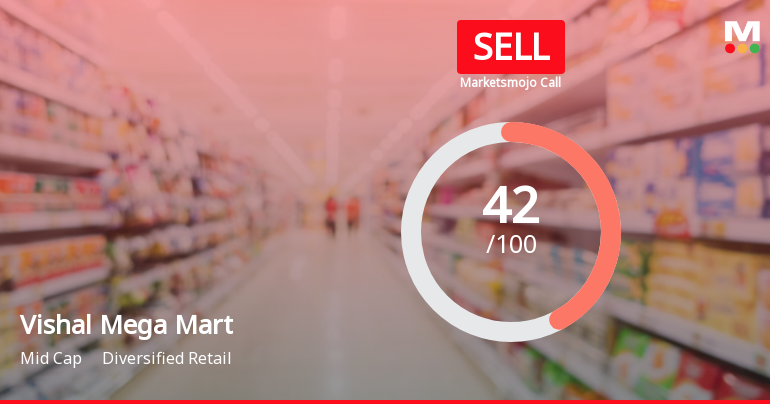
Vishal Mega Mart Ltd is Rated Sell
Vishal Mega Mart Ltd is rated 'Sell' by MarketsMOJO, with this rating last updated on 12 May 2026. However, the analysis and financial metrics discussed here reflect the stock's current position as of 26 June 2026, providing investors with an up-to-date view of the company’s fundamentals, returns, and market performance.
Read full news article Announcements
Closure of Trading Window
24-Jun-2026 | Source : BSEIntimation regarding Closure of Trading Window
Intimation Of Grant Of 975000 Stock Options Under Vishal Mega Mart Employees Stock Options Plan 2019
15-Jun-2026 | Source : BSEIntimation of grant of 975000 Stock Options under Vishal Mega Mart Employees Stock Options Plan 2019
Announcement under Regulation 30 (LODR)-Change in Management
15-Jun-2026 | Source : BSEAppointment of Mr. Sashi Gumma as Chief of Operations and Senior Management Personnel of the Company
Corporate Actions

No Upcoming Board Meetings

No Dividend history available

No Splits history available

No Bonus history available

No Rights history available
Quality key factors
Valuation key factors
Technicals key factors
 Technical Indicator Scale: Bearish, Mildly Bearish, Sideways, Mildly Bullish, Bullish Turned
 Shareholding Snapshot : Mar 2026
Shareholding Compare (%holding)
Promoters
None
Held by 33 Schemes (28.89%)
Held by 483 FIIs (22.01%)
Samayat Services Llp (40.12%)
Government Of Singapore (2.81%)
4.14%
Quarterly Results Snapshot (Consolidated) - Mar'26 - QoQ

QoQ Growth in quarter ended Mar 2026 is -15.16% vs 23.11% in Dec 2025
QoQ Growth in quarter ended Mar 2026 is -46.34% vs 105.45% in Dec 2025
Half Yearly Results Snapshot (Standalone) - Sep'25
Not Applicable: The company has declared_date for only one period
Not Applicable: The company has declared_date for only one period
Nine Monthly Results Snapshot (Standalone) - Dec'25
Not Applicable: The company has declared_date for only one period
Not Applicable: The company has declared_date for only one period
Annual Results Snapshot (Consolidated) - Mar'26

YoY Growth in year ended Mar 2026 is 20.44% vs 20.25% in Mar 2025
YoY Growth in year ended Mar 2026 is 32.80% vs 36.81% in Mar 2025
About Vishal Mega Mart Ltd

Company Coordinates


