
Compare Standard Enginee with Similar Stocks
Dashboard
The company is Net-Debt Free
Poor long term growth as Operating profit has grown by an annual rate 9.67% of over the last 5 years
Positive results in Mar 26
With ROE of 10.1, it has a Very Expensive valuation with a 7.1 Price to Book Value
Despite the size of the company, domestic mutual funds hold only 0.5% of the company
Market Beating Performance
Stock DNA
Industrial Manufacturing
INR 5,496 Cr (Small Cap)
70.00
37
0.00%
-0.04
10.15%
7.14
Total Returns (Price + Dividend) 
Standard Enginee for the last several years.
Risk Adjusted Returns v/s
Returns Beta

News
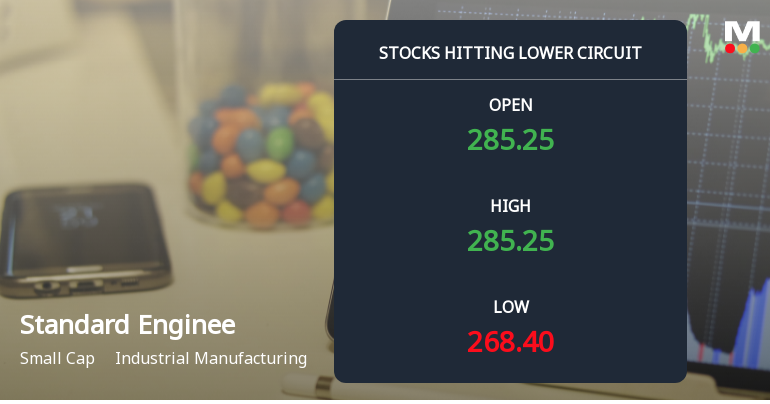
Standard Enginnering Technology Ltd Locks at Lower Circuit With 4.9% Loss — Sellers Queue, No Buyers in Sight
At Rs 268.95, sellers were still queuing — but there were no buyers willing to take the other side. Standard Enginnering Technology Ltd locked at its lower circuit of 4.9% on 28 Jul 2026, with unfilled sell orders and a frozen price.
Read full news article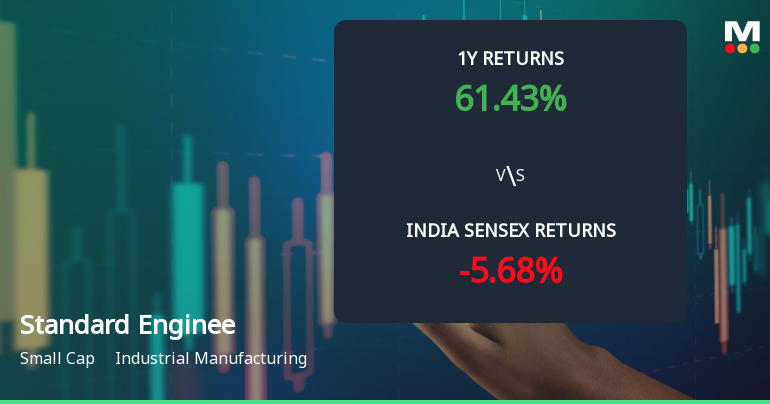
Standard Engineering Technology Ltd Shows Bullish Momentum Amid Technical Upgrades
Standard Engineering Technology Ltd has demonstrated a notable shift in price momentum, transitioning from a mildly bullish to a bullish technical trend. This change is underpinned by a series of positive signals across key technical indicators, signalling renewed investor interest and potential upside in the small-cap industrial manufacturing stock.
Read full news article
Standard Enginnering Technology Ltd Locks at Lower Circuit With 4.18% Loss — Sellers Queue, No Buyers in Sight
At Rs 274.95, Standard Enginnering Technology Ltd locked at its lower circuit on 24 Jul 2026, falling 4.18% within a 5% price band. Sellers were lined up at the floor price of Rs 272.65, but buyers were absent, resulting in unfilled supply and a frozen trading price.
Read full news article Announcements
Announcement under Regulation 30 (LODR)-Updates on Acquisition
24-Jul-2026 | Source : BSEPlease see annexed enclosure
Announcement under Regulation 30 (LODR)-Newspaper Publication
19-Jul-2026 | Source : BSEPlease find the attached intimation of the newspaper publication regarding the notice of the extraordinary general meeting of the Company
Extra Ordinary General Meeting (EGM) Of The Members Of The Company Will Be Held On Monday August 10 2026 At 11.00 AM (IST) Through Video Conferencing (VC) / Other Audio-Visual Means (OAVM)
17-Jul-2026 | Source : BSEPlease see annexed enclosure
Corporate Actions

No Upcoming Board Meetings

No Dividend history available

No Splits history available

No Bonus history available

No Rights history available
Quality key factors
Valuation key factors
Technicals key factors
 Technical Indicator Scale: Bearish, Mildly Bearish, Sideways, Mildly Bullish, Bullish Turned
 Shareholding Snapshot : Jun 2026
Shareholding Compare (%holding)
Promoters
21.3799
Held by 1 Schemes (0.2%)
Held by 9 FIIs (2.77%)
Ramakrishna Kandula (22.09%)
Asahi Glassplant Inc. (5.24%)
21.97%
Quarterly Results Snapshot (Consolidated) - Mar'26 - QoQ

QoQ Growth in quarter ended Mar 2026 is 18.33% vs 4.81% in Dec 2025
QoQ Growth in quarter ended Mar 2026 is 3.18% vs -4.95% in Dec 2025
Half Yearly Results Snapshot (Standalone) - Sep'25
Not Applicable: The company has declared_date for only one period
Not Applicable: The company has declared_date for only one period
Nine Monthly Results Snapshot (Standalone) - Dec'25
Not Applicable: The company has declared_date for only one period
Not Applicable: The company has declared_date for only one period
Annual Results Snapshot (Consolidated) - Mar'26
YoY Growth in year ended Mar 2026 is 26.14% vs 12.87% in Mar 2025
YoY Growth in year ended Mar 2026 is 24.40% vs 10.21% in Mar 2025
About Standard Enginnering Technology Ltd

Company Coordinates


