
Compare Indef Manufactur with Similar Stocks
Dashboard
Poor long term growth as Operating profit has grown by an annual rate -10.29% of over the last 5 years
Flat results in Mar 26
With ROE of 10.5, it has a Expensive valuation with a 3.1 Price to Book Value
Despite the size of the company, domestic mutual funds hold only 0% of the company
Below par performance in long term as well as near term
Stock DNA
Industrial Manufacturing
INR 808 Cr (Micro Cap)
32.00
38
0.82%
-0.01
10.50%
3.07
Total Returns (Price + Dividend) 
Latest dividend: 2.01211415259173 per share ex-dividend date: Aug-05-2025
Risk Adjusted Returns v/s
Returns Beta

News
Indef Manufacturing Ltd is Rated Sell
Indef Manufacturing Ltd is rated 'Sell' by MarketsMOJO, with this rating last updated on 25 May 2026. However, the analysis and financial metrics discussed here reflect the stock's current position as of 22 June 2026, providing investors with an up-to-date view of the company’s performance and outlook.
Read full news article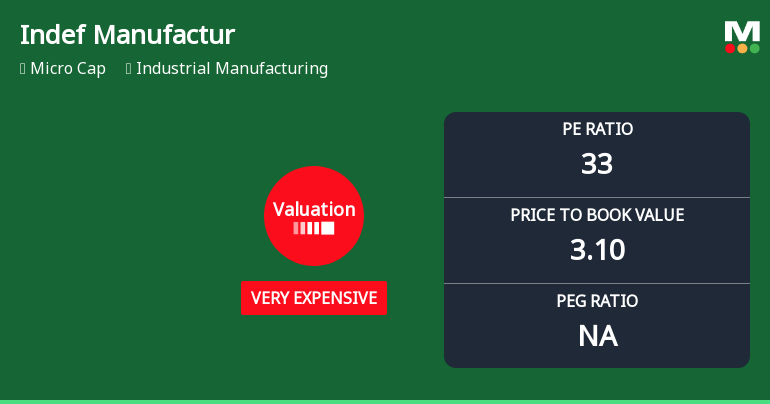
Indef Manufacturing Ltd Valuation Shifts Signal Heightened Price Risk
Indef Manufacturing Ltd has seen its valuation metrics shift markedly, moving from an expensive to a very expensive classification, despite a mixed performance track record and a recent upgrade in its Mojo Grade from Strong Sell to Sell. This article analyses the evolving price attractiveness of the stock, comparing key valuation parameters against historical levels and peer averages within the industrial manufacturing sector.
Read full news article
Indef Manufacturing Ltd is Rated Sell
Indef Manufacturing Ltd is rated 'Sell' by MarketsMOJO, with this rating last updated on 25 May 2026. However, the analysis and financial metrics discussed here reflect the stock's current position as of 11 June 2026, providing investors with the most up-to-date view of the company’s performance and outlook.
Read full news article Announcements
Compliances-Reg.24(A)-Annual Secretarial Compliance
26-May-2026 | Source : BSEPlease find attached the Annual Secretarial Compliance Report for the period ended March 31 2026.
Announcement under Regulation 30 (LODR)-Change in Management
25-May-2026 | Source : BSEAppointment of Shri Mahendrakumar Gohel (08254455) as additional director (Non-executive Independent) and appointment of Smt. Pooja Bajaj (DIN: 09425947)as the additonal director (Non executive non independent) and Appointment of Cost Auditor of the Company.
Corporate Action-Board approves Dividend
25-May-2026 | Source : BSEBoard has recommended the Final Dividend of Rs. 2/- per share for F.Y. 2025-26 and AGM date.
Corporate Actions

No Upcoming Board Meetings

Indef Manufacturing Ltd has declared 200% dividend, ex-date: 05 Aug 25

No Splits history available

No Bonus history available

No Rights history available
Quality key factors
Valuation key factors
Technicals key factors
 Technical Indicator Scale: Bearish, Mildly Bearish, Sideways, Mildly Bullish, Bullish Turned
 Shareholding Snapshot : Mar 2026
Shareholding Compare (%holding)
Promoters
None
Held by 0 Schemes
Held by 4 FIIs (1.57%)
Bajaj Holdings And Investment Ltd (19.53%)
Indef Manufacturing Limited-unclaimed Securities Suspense Escrow Account (5.23%)
20.64%
Quarterly Results Snapshot (Standalone) - Mar'26 - QoQ

QoQ Growth in quarter ended Mar 2026 is 25.56% vs 1.63% in Dec 2025
QoQ Growth in quarter ended Mar 2026 is 17.58% vs -7.46% in Dec 2025
Half Yearly Results Snapshot (Standalone) - Sep'25
Not Applicable: The company has declared_date for only one period
Not Applicable: The company has declared_date for only one period
Nine Monthly Results Snapshot (Standalone) - Dec'25
Not Applicable: The company has declared_date for only one period
Not Applicable: The company has declared_date for only one period
Annual Results Snapshot (Standalone) - Mar'26
YoY Growth in year ended Mar 2026 is 10.72% vs -1.57% in Mar 2025

YoY Growth in year ended Mar 2026 is -23.92% vs 26.11% in Mar 2025
About Indef Manufacturing Ltd

Company Coordinates


