
Compare Sambhv Steel with Similar Stocks
Dashboard
High Management Efficiency with a high ROCE of 15.24%
Healthy long term growth as Net Sales has grown by an annual rate of 27.00% and Operating profit at 9.03%
With a growth in Net Profit of 131.16%, the company declared Very Positive results in Mar 26
Majority shareholders : Promoters
Stock DNA
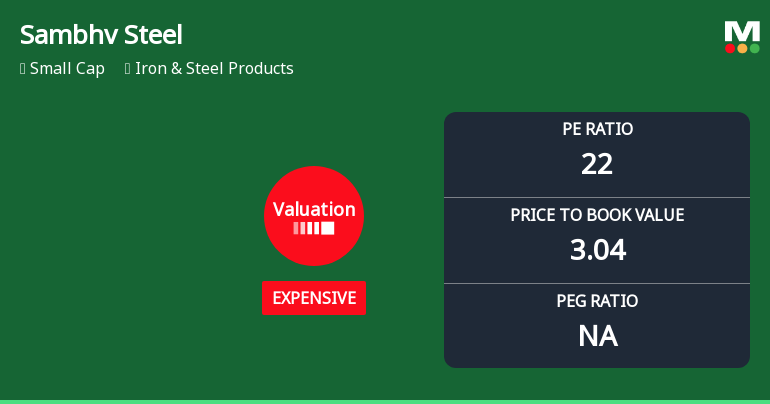
Iron & Steel Products
INR 3,181 Cr (Small Cap)
22.00
26
0.00%
0.18
13.58%
3.04
Total Returns (Price + Dividend) 
Sambhv Steel for the last several years.
Risk Adjusted Returns v/s
Returns Beta

News
Sambhv Steel Tubes Ltd Valuation Shifts Signal Changing Price Attractiveness
Sambhv Steel Tubes Ltd has witnessed a notable change in its valuation parameters, shifting from fair to expensive territory, reflecting evolving market perceptions amid a robust operational backdrop. This recalibration in price multiples invites a closer examination of its price-to-earnings (P/E) and price-to-book value (P/BV) ratios relative to historical averages and peer benchmarks, offering investors fresh insights into the stock’s attractiveness within the iron and steel products sector.
Read full news article
Sambhv Steel Tubes Ltd is Rated Buy
Sambhv Steel Tubes Ltd is rated 'Buy' by MarketsMOJO, with this rating last updated on 25 May 2026. However, the analysis and financial metrics discussed here reflect the stock's current position as of 10 June 2026, providing investors with the latest insights into the company’s performance and outlook.
Read full news article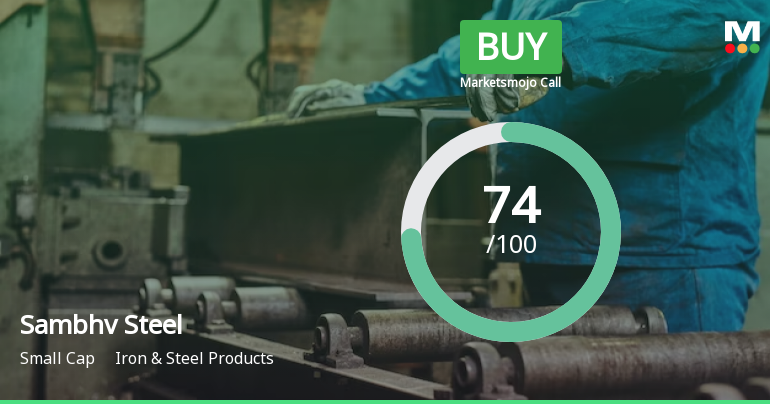
Sambhv Steel Tubes Ltd is Rated Buy
Sambhv Steel Tubes Ltd is rated 'Buy' by MarketsMOJO, with this rating last updated on 25 May 2026. However, the analysis and financial metrics discussed here reflect the stock's current position as of 30 May 2026, providing investors with the latest insights into the company’s performance and outlook.
Read full news article Announcements
Announcement under Regulation 30 (LODR)-Newspaper Publication
10-Jun-2026 | Source : BSESambhv Steel Tubes Limited informed the Exchanges about Newspaper Publication regarding dispatch of postal ballot notice and e-voting matters.
Shareholder Meeting / Postal Ballot-Notice of Postal Ballot
09-Jun-2026 | Source : BSESambhv Steel Tubes Limited has informed exchange regarding the Notice of Postal Ballot dated June 09 2026
Announcement under Regulation 30 (LODR)-Analyst / Investor Meet - Intimation
04-Jun-2026 | Source : BSEWe wish to inform you that pursuant to Regulation 30 of the SEBI (LODR) Regulations 2015 we hereby disclose the schedule of the Analyst/ Institutional Investor meeting with the company to be held on June 10 2026
Corporate Actions

No Upcoming Board Meetings

No Dividend history available

No Splits history available

No Bonus history available

No Rights history available
Quality key factors
Valuation key factors
Technicals key factors
 Technical Indicator Scale: Bearish, Mildly Bearish, Sideways, Mildly Bullish, Bullish Turned
 Shareholding Snapshot : Mar 2026
Shareholding Compare (%holding)
Promoters
None
Held by 2 Schemes (1.41%)
Held by 9 FIIs (1.52%)
Suman Goyal (6.49%)
Archana Goyal (6.48%)
31.92%
Quarterly Results Snapshot (Standalone) - Mar'26 - QoQ

QoQ Growth in quarter ended Mar 2026 is 16.32% vs 1.55% in Dec 2025
QoQ Growth in quarter ended Mar 2026 is 131.16% vs -19.49% in Dec 2025
Half Yearly Results Snapshot (Standalone) - Sep'25
Not Applicable: The company has declared_date for only one period
Not Applicable: The company has declared_date for only one period
Nine Monthly Results Snapshot (Standalone) - Dec'25
Not Applicable: The company has declared_date for only one period
Not Applicable: The company has declared_date for only one period
Annual Results Snapshot (Standalone) - Mar'26
YoY Growth in year ended Mar 2026 is 59.67% vs 17.55% in Mar 2025
YoY Growth in year ended Mar 2026 is 146.85% vs -29.60% in Mar 2025
About Sambhv Steel Tubes Ltd

Company Coordinates


