
Compare Mangal Electrica with Similar Stocks
Stock DNA
Other Electrical Equipment
INR 855 Cr (Micro Cap)
18.00
53
0.00%
-0.08
7.31%
1.35
Total Returns (Price + Dividend) 
Mangal Electrica for the last several years.
Risk Adjusted Returns v/s
Returns Beta

News
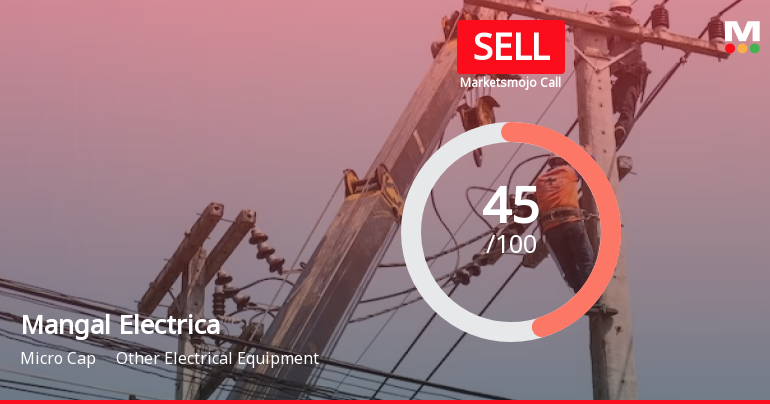
Mangal Electrical Industries Ltd is Rated Sell
Mangal Electrical Industries Ltd is rated 'Sell' by MarketsMOJO, with this rating last updated on 23 June 2026. However, the analysis and financial metrics discussed here reflect the stock's current position as of 27 July 2026, providing investors with an up-to-date view of the company’s fundamentals, valuation, financial trends, and technical outlook.
Read full news articleWhen is the next results date for Mangal Electrical Industries Ltd?
The next results date for Mangal Electrical Industries Ltd is scheduled for July 29, 2026....
Read full news article
Mangal Electrical Industries Ltd is Rated Sell
Mangal Electrical Industries Ltd is rated 'Sell' by MarketsMOJO, with this rating last updated on 23 June 2026. However, the analysis and financial metrics discussed here reflect the stock's current position as of 16 July 2026, providing investors with an up-to-date view of the company’s fundamentals, valuation, financial trend, and technical outlook.
Read full news article Announcements
Board Meeting Intimation for Pursuant To Regulations 29 Of The Securities And Exchange Board Of India (Listing Obligations And Disclosure Requirements) Regulations 2015- Prior Intimation Of Board Meeting
20-Jul-2026 | Source : BSEMangal Electrical Industries Ltdhas informed BSE that the meeting of the Board of Directors of the Company is scheduled on 29/07/2026 inter alia to consider and approve Board of Directors of the Company is scheduled to be held on Wednesday July 29 2026 inter alia to consider and approve the unaudited financial results of the Company for the quarter ended June 30 2026.
Compliances-Certificate under Reg. 74 (5) of SEBI (DP) Regulations 2018
09-Jul-2026 | Source : BSECertificate under Regulation 74(5) of the SEBI (DP) Regulations 2018 for the quarter ended June 30 2026.
Disclosure Under Regulation 30 Of The SEBI (Listing Obligations And Disclosure Requirements) Regulations 2015 - Acquisition Of Industrial Land
29-Jun-2026 | Source : BSEDisclosure under Regulation 30 of SEBI (LODR) Regulation 2015
Corporate Actions

29 Jul 2026

No Dividend history available

No Splits history available

No Bonus history available

No Rights history available
Quality key factors
Valuation key factors
Technicals key factors
 Technical Indicator Scale: Bearish, Mildly Bearish, Sideways, Mildly Bullish, Bullish Turned
 Shareholding Snapshot : Jun 2026
Shareholding Compare (%holding)
Promoters
None
Held by 0 Schemes
Held by 3 FIIs (1.28%)
Rahul Mangal (30.48%)
Abakkus Diversified Alpha Fund (2.89%)
15.88%
Quarterly Results Snapshot (Standalone) - Mar'26 - QoQ

QoQ Growth in quarter ended Mar 2026 is 14.81% vs 1.26% in Dec 2025

QoQ Growth in quarter ended Mar 2026 is -4.78% vs 0.68% in Dec 2025
Half Yearly Results Snapshot (Standalone) - Sep'25
Not Applicable: The company has declared_date for only one period
Not Applicable: The company has declared_date for only one period
Nine Monthly Results Snapshot (Standalone) - Dec'25
Not Applicable: The company has declared_date for only one period
Not Applicable: The company has declared_date for only one period
Annual Results Snapshot (Standalone) - Mar'26
YoY Growth in year ended Mar 2026 is 5.51% vs 22.23% in Mar 2025
YoY Growth in year ended Mar 2026 is -8.75% vs 125.82% in Mar 2025
About Mangal Electrical Industries Ltd

Company Coordinates


