
Compare Om Freight Forwa with Similar Stocks
Dashboard
The company is Net-Debt Free
Poor long term growth as Net Sales has grown by an annual rate of 0% and Operating profit at 0% over the last 5 years
Flat results in Mar 26
With ROE of 7.5, it has a Expensive valuation with a 1.5 Price to Book Value
Falling Participation by Institutional Investors
Stock DNA
Transport Services
INR 303 Cr (Micro Cap)
20.00
39
0.00%
0.01
7.50%
1.51
Total Returns (Price + Dividend) 
Om Freight Forwa for the last several years.
Risk Adjusted Returns v/s
Returns Beta

News

Om Freight Forwarders Ltd is Rated Hold
Om Freight Forwarders Ltd is rated 'Hold' by MarketsMOJO, with this rating last updated on 15 June 2026. However, the analysis and financial metrics discussed here reflect the company’s current position as of 25 July 2026, providing investors with the most up-to-date insight into the stock’s fundamentals and market performance.
Read full news article
Om Freight Forwarders Ltd is Rated Hold by MarketsMOJO
Om Freight Forwarders Ltd is rated 'Hold' by MarketsMOJO, with this rating last updated on 15 June 2026. However, the analysis and financial metrics presented here reflect the stock's current position as of 14 July 2026, providing investors with an up-to-date view of the company's fundamentals, valuation, financial trends, and technical outlook.
Read full news article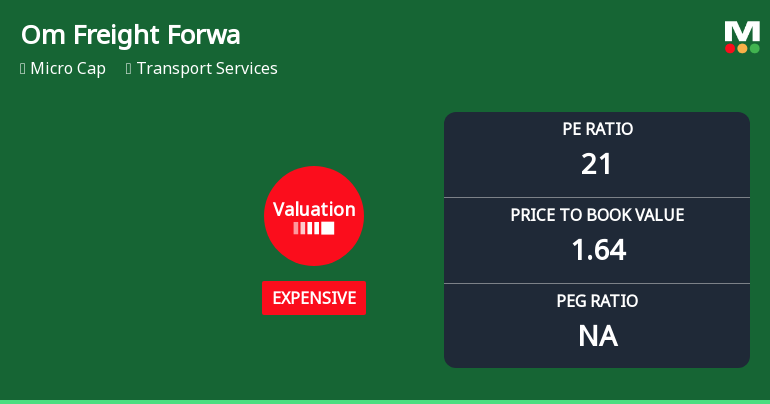
Om Freight Forwarders Ltd Valuation Shifts Signal Changing Market Sentiment
Om Freight Forwarders Ltd has recently undergone a notable shift in its valuation parameters, moving from a 'very expensive' to an 'expensive' classification. This change, reflected in key metrics such as the price-to-earnings (P/E) and price-to-book value (P/BV) ratios, invites a closer examination of the stock’s price attractiveness relative to its historical averages and peer group within the transport services sector.
Read full news article Announcements
Compliances-Certificate under Reg. 74 (5) of SEBI (DP) Regulations 2018
13-Jul-2026 | Source : BSECertificate under Regulation 74(5) of SEBI (Depositories and Participants) Regulations 2018 for the quarter ended June 30 2026.
Closure of Trading Window
25-Jun-2026 | Source : BSEOm Freight Forwarders Limited has informed the exchange regarding the closure of trading window pursuant to SEBI (PIT) Regulations 2015 for the quarter ended June 30 2026.
Shareholder Meeting / Postal Ballot-Scrutinizers Report
23-Jun-2026 | Source : BSEScrutinizer Report of postal ballot and Disclosure of voting results.
Corporate Actions

No Upcoming Board Meetings

No Dividend history available

No Splits history available

No Bonus history available

No Rights history available
Quality key factors
Valuation key factors
Technicals key factors
 Technical Indicator Scale: Bearish, Mildly Bearish, Sideways, Mildly Bullish, Bullish Turned
 Shareholding Snapshot : Jun 2026
Shareholding Compare (%holding)
Promoters
None
Held by 0 Schemes
Held by 3 FIIs (0.29%)
Rahul Jagannath Joshi (30.74%)
Ashika Global Finance Private Limited (1.61%)
16.72%
Quarterly Results Snapshot (Standalone) - Mar'26 - QoQ

QoQ Growth in quarter ended Mar 2026 is 25.55% vs 4.63% in Dec 2025

QoQ Growth in quarter ended Mar 2026 is -9.60% vs 15.46% in Dec 2025
Half Yearly Results Snapshot (Standalone) - Sep'25
Not Applicable: The company has declared_date for only one period
Not Applicable: The company has declared_date for only one period
Nine Monthly Results Snapshot (Standalone) - Dec'25
Not Applicable: The company has declared_date for only one period
Not Applicable: The company has declared_date for only one period
Annual Results Snapshot (Standalone) - Mar'26
Not Applicable: The company has declared_date for only one period
Not Applicable: The company has declared_date for only one period
About Om Freight Forwarders Ltd

Company Coordinates


