
Compare Midwest with Similar Stocks
Stock DNA
Diversified consumer products
INR 4,441 Cr (Small Cap)
43.00
31
0.00%
-0.04
10.90%
4.66
Total Returns (Price + Dividend) 
Midwest for the last several years.
Risk Adjusted Returns v/s
Returns Beta

News

Midwest Ltd Technical Momentum Shifts Amid Bearish Outlook
Midwest Ltd, a small-cap player in the diversified consumer products sector, has experienced a notable shift in its technical momentum, moving from a mildly bearish stance to a sideways trend. Despite a modest daily price increase of 0.55%, the company’s overall technical indicators and market performance reveal a complex picture amid broader sectoral and market pressures.
Read full news article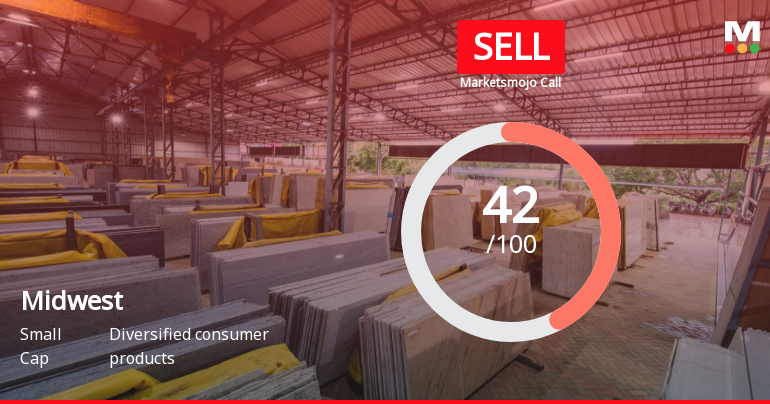
Midwest Ltd is Rated Sell
Midwest Ltd is rated Sell by MarketsMOJO, with this rating last updated on 20 July 2026. However, the analysis and financial metrics discussed here reflect the company’s current position as of 24 July 2026, providing investors with the latest insights into its performance and outlook.
Read full news article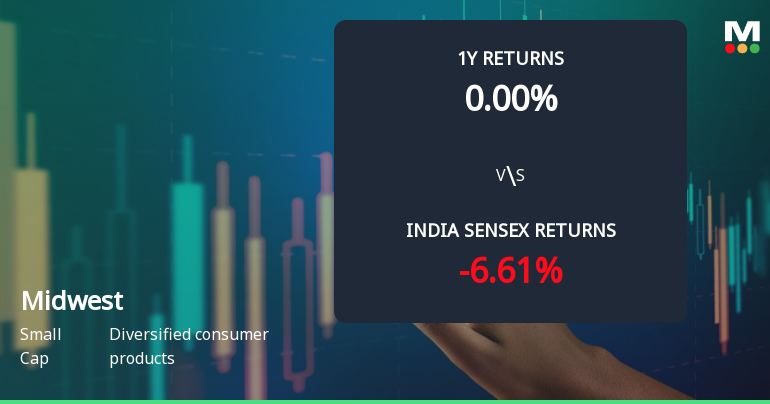
Midwest Ltd Faces Technical Setback as Momentum Shifts to Mildly Bearish
Midwest Ltd, a small-cap player in the diversified consumer products sector, has experienced a notable shift in its technical momentum, moving from a sideways trend to a mildly bearish stance. This change is underscored by mixed signals from key technical indicators such as MACD, RSI, Bollinger Bands, and moving averages, reflecting growing market caution amid broader sectoral and benchmark underperformance.
Read full news article Announcements
Announcement under Regulation 30 (LODR)-Press Release / Media Release
07-Jul-2026 | Source : BSEMidwest Limited along with Midwest Energy Limited and Non-Ferrous Materials Technology Development Technology Centre (NFTDC) has signed a Memorandum of Understanding with PT Perushaan Mineral Nasional (Persero) Indonesias state-owned strategic minerals enterprise.
Compliances-Certificate under Reg. 74 (5) of SEBI (DP) Regulations 2018
02-Jul-2026 | Source : BSECertificate under Reg 74 (5) of SEBI (DP) Regulations 2018 for the Quarter ended June 30 2026.
Closure of Trading Window
29-Jun-2026 | Source : BSEClosure of Trading Window
Corporate Actions

No Upcoming Board Meetings

No Dividend history available

No Splits history available

No Bonus history available

No Rights history available
Quality key factors
Valuation key factors
Technicals key factors
 Technical Indicator Scale: Bearish, Mildly Bearish, Sideways, Mildly Bullish, Bullish Turned
 Shareholding Snapshot : Jun 2026
Shareholding Compare (%holding)
Promoters
1.3918
Held by 5 Schemes (7.07%)
Held by 11 FIIs (3.88%)
Rama Raghava Reddy Kollareddy (64.1%)
Svadha India Emerging Opportunities Scheme 1 (7.35%)
3.19%
Quarterly Results Snapshot (Standalone) - Mar'26 - QoQ

QoQ Growth in quarter ended Mar 2026 is 14.31% vs -15.71% in Dec 2025

QoQ Growth in quarter ended Mar 2026 is -11.46% vs -0.62% in Dec 2025
Half Yearly Results Snapshot (Standalone) - Sep'25
Not Applicable: The company has declared_date for only one period
Not Applicable: The company has declared_date for only one period
Nine Monthly Results Snapshot (Standalone) - Dec'25
Not Applicable: The company has declared_date for only one period
Not Applicable: The company has declared_date for only one period
Annual Results Snapshot (Consolidated) - Mar'26
YoY Growth in year ended Mar 2026 is 3.10% vs 6.93% in Mar 2025
YoY Growth in year ended Mar 2026 is -14.35% vs 26.81% in Mar 2025
About Midwest Ltd

Company Coordinates


