
Compare Emmvee Photovol. with Similar Stocks
Dashboard
High Management Efficiency with a high ROE of 0%
The company is Net-Debt Free
Healthy long term growth as Net Sales has grown by an annual rate of 0% and Operating profit at 0%
With a growth in Net Profit of 25.41%, the company declared Very Positive results in Jun 26
Company is among the highest 1% of companies rated by MarketsMojo across all 4,000 stocks
Stock DNA
Other Electrical Equipment
INR 21,438 Cr (Small Cap)
17.00
52
0.00%
-0.01
29.27%
5.94
Total Returns (Price + Dividend) 
Emmvee Photovol. for the last several years.
Risk Adjusted Returns v/s
Returns Beta

News
Emmvee Photovoltaic Power Ltd is Rated Buy
Emmvee Photovoltaic Power Ltd is rated 'Buy' by MarketsMOJO, with this rating last updated on 07 Jul 2026. While the rating was revised on that date, the analysis and financial metrics discussed here reflect the stock's current position as of 30 July 2026, providing investors with the latest insights into the company’s performance and outlook.
Read full news article
Emmvee Photovoltaic Power Ltd Sees Technical Momentum Shift Amid Mixed Market Signals
Emmvee Photovoltaic Power Ltd, a small-cap player in the Other Electrical Equipment sector, has experienced a notable shift in its technical momentum, moving from a bullish to a mildly bullish stance. Despite a recent day decline of 2.44%, the stock’s year-to-date return of 74.96% significantly outpaces the Sensex’s negative 8.81% over the same period, signalling underlying strength amid broader market volatility.
Read full news article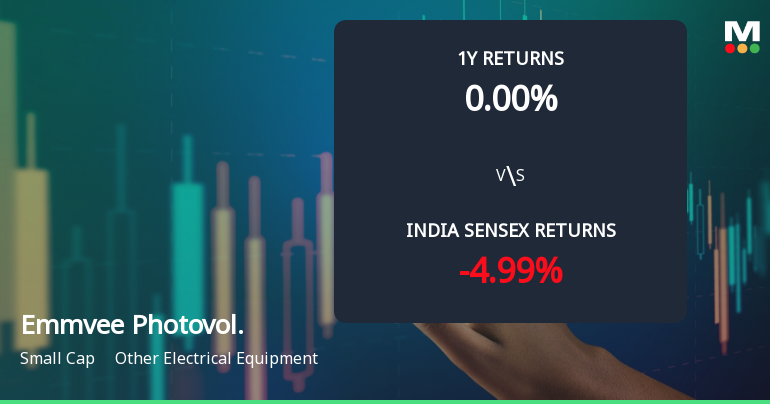
Emmvee Photovoltaic Power Ltd Technical Momentum Shifts Signal Bullish Outlook
Emmvee Photovoltaic Power Ltd, a small-cap player in the Other Electrical Equipment sector, has experienced a notable shift in its technical momentum, moving from a mildly bullish stance to a more confident bullish trend. Despite a recent day decline of 5.73%, the company’s technical indicators suggest a strengthening underlying momentum, supported by positive signals from MACD, Bollinger Bands, and Dow Theory assessments.
Read full news article Announcements
Announcement under Regulation 30 (LODR)-Earnings Call Transcript
22-Jul-2026 | Source : BSEPlease find the attached transcript of Q1FY27 earning conference call held on July 16 2026.
Announcement under Regulation 30 (LODR)-Newspaper Publication
16-Jul-2026 | Source : BSEPursuant to Regulation 47 of SEBI (LODR) Regulations 2015 we are attaching herewith newspaper clipping of unaudited financial results for quarter ended June 30 2026.
Announcement under Regulation 30 (LODR)-Analyst / Investor Meet - Outcome
16-Jul-2026 | Source : BSEEmmvee Photovoltaic Power Limited has informed the Exchange about the weblink of audio recording of the Q1FY27 earnings call.
Corporate Actions

No Upcoming Board Meetings

No Dividend history available

No Splits history available

No Bonus history available

No Rights history available
Quality key factors
Valuation key factors
Technicals key factors
 Technical Indicator Scale: Bearish, Mildly Bearish, Sideways, Mildly Bullish, Bullish Turned
 Shareholding Snapshot : Jun 2026
Shareholding Compare (%holding)
Promoters
None
Held by 21 Schemes (6.24%)
Held by 59 FIIs (2.92%)
Shubha Manjunatha Donthi (38.46%)
Icici Prudential S&p Bse 500 Etf (1.61%)
5.64%
Quarterly Results Snapshot (Standalone) - Jun'26 - QoQ

QoQ Growth in quarter ended Jun 2026 is -20.11% vs 234.80% in Mar 2026
QoQ Growth in quarter ended Jun 2026 is 25.41% vs 107.48% in Mar 2026
Half Yearly Results Snapshot (Standalone) - Sep'25
Not Applicable: The company has declared_date for only one period
Not Applicable: The company has declared_date for only one period
Nine Monthly Results Snapshot (Standalone) - Dec'25
Not Applicable: The company has declared_date for only one period
Not Applicable: The company has declared_date for only one period
Annual Results Snapshot (Consolidated) - Mar'26
YoY Growth in year ended Mar 2026 is 116.21% vs 145.35% in Mar 2025
YoY Growth in year ended Mar 2026 is 193.10% vs 1,176.85% in Mar 2025
About Emmvee Photovoltaic Power Ltd

Company Coordinates


