
Compare Tenneco Clean with Similar Stocks
Dashboard
Strong Long Term Fundamental Strength with an average Return on Equity (ROE) of 0%
- The company is Net-Debt Free
Flat results in Mar 26
With ROE of 52.1, it has a Very Expensive valuation with a 18.8 Price to Book Value
High Institutional Holdings at 21.52%
With its market cap of Rs 22,461 cr, it is the second biggest company in the sector (behind Thermax)and constitutes 8.26% of the entire sector
Stock DNA
Industrial Products
INR 22,107 Cr (Small Cap)
36.00
38
0.00%
-0.43
52.09%
18.76
Total Returns (Price + Dividend) 
Tenneco Clean for the last several years.
Risk Adjusted Returns v/s
Returns Beta

News

Tenneco Clean Air India Ltd is Rated Hold
Tenneco Clean Air India Ltd is rated 'Hold' by MarketsMOJO, with this rating last updated on 06 Jul 2026. However, the analysis and financial metrics discussed below reflect the stock's current position as of 23 July 2026, providing investors with an up-to-date view of the company’s fundamentals, valuation, financial trends, and technical outlook.
Read full news article
Tenneco Clean Air India Ltd Technical Momentum Shifts Amid Sideways Trend
Tenneco Clean Air India Ltd has witnessed a notable shift in its technical momentum, transitioning from a mildly bearish stance to a sideways trend, reflecting a period of consolidation. Despite a modest decline of 0.83% on 16 Jul 2026, the stock’s technical indicators reveal a complex interplay of signals that suggest cautious optimism for investors navigating the industrial products sector.
Read full news article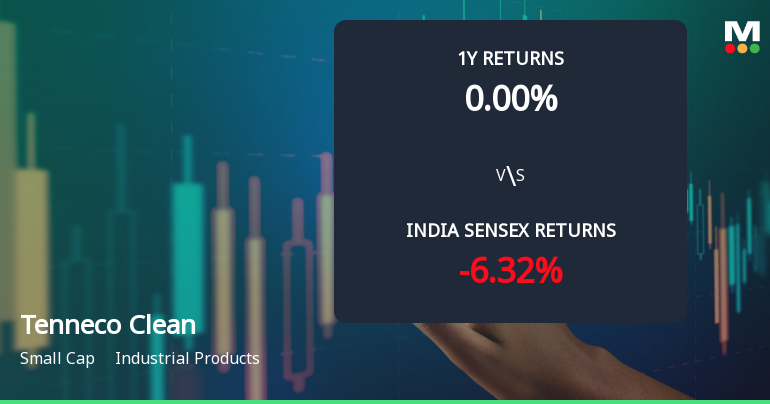
Tenneco Clean Air India Ltd Technical Momentum Shifts Amid Market Volatility
Tenneco Clean Air India Ltd has experienced a notable shift in its technical momentum, moving from a mildly bullish to a mildly bearish trend. This change is underscored by mixed signals from key technical indicators such as the MACD, RSI, Bollinger Bands, and moving averages, reflecting a cautious outlook for this small-cap industrial products stock amid recent price volatility.
Read full news article Announcements
Compliances-Certificate under Reg. 74 (5) of SEBI (DP) Regulations 2018
13-Jul-2026 | Source : BSEPlease find enclosed the certificate under SEBI (DP) Regulations.
Closure of Trading Window
26-Jun-2026 | Source : BSEPlease find attached the Intimation for Trading Window Closure
Announcement under Regulation 30 (LODR)-Earnings Call Transcript
09-Jun-2026 | Source : BSEPlease find enclosed the Earnings Call Transcript
Corporate Actions

No Upcoming Board Meetings

No Dividend history available

No Splits history available

No Bonus history available

No Rights history available
Quality key factors
Valuation key factors
Technicals key factors
 Technical Indicator Scale: Bearish, Mildly Bearish, Sideways, Mildly Bullish, Bullish Turned
 Shareholding Snapshot : Mar 2026
Shareholding Compare (%holding)
Promoters
None
Held by 27 Schemes (7.64%)
Held by 53 FIIs (8.94%)
Tenneco Mauritius Holdings Limited (60.22%)
Axis Mutual Fund Trustee Limited A/c Axis Mutual Fund A/c Axis Small Cap Fund (1.65%)
2.59%
Quarterly Results Snapshot (Standalone) - Mar'26 - QoQ

QoQ Growth in quarter ended Mar 2026 is 32.57% vs -6.40% in Dec 2025
QoQ Growth in quarter ended Mar 2026 is 53.03% vs -93.60% in Dec 2025
Half Yearly Results Snapshot (Standalone) - Sep'25
Not Applicable: The company has declared_date for only one period
Not Applicable: The company has declared_date for only one period
Nine Monthly Results Snapshot (Standalone) - Dec'25
Not Applicable: The company has declared_date for only one period
Not Applicable: The company has declared_date for only one period
Annual Results Snapshot (Standalone) - Mar'26
Not Applicable: The company has declared_date for only one period
Not Applicable: The company has declared_date for only one period
About Tenneco Clean Air India Ltd

Company Coordinates


