
Compare Gaudium IVF with Similar Stocks
Stock DNA
Healthcare Services
INR 946 Cr (Micro Cap)
35.00
63
0.00%
0.10
16.08%
6.45
Total Returns (Price + Dividend) 
Gaudium IVF for the last several years.
Risk Adjusted Returns v/s
Returns Beta

News

Gaudium IVF and Women Health Ltd Upgraded to Hold on Technical and Valuation Shifts
Gaudium IVF and Women Health Ltd has seen its investment rating upgraded from Sell to Hold, reflecting a nuanced shift in its technical outlook and valuation metrics. The micro-cap healthcare services company’s recent performance and financial indicators have prompted analysts to reassess its standing, balancing improved technical signals against a stretched valuation and evolving financial trends.
Read full news article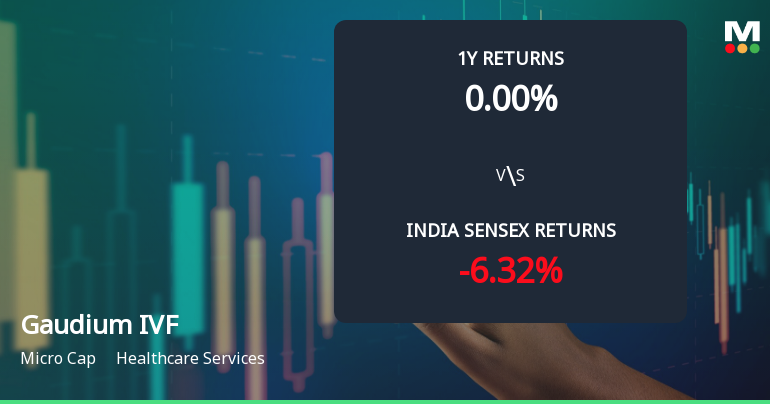
Gaudium IVF and Women Health Ltd Shows Renewed Momentum with Technical Upgrades
Gaudium IVF and Women Health Ltd has shifted from a sideways technical trend to a mildly bullish stance, supported by key technical indicators and a notable price momentum surge. The micro-cap healthcare services company’s recent performance signals a potential turnaround, with its stock price nearing a 52-week high and technical metrics reflecting improved investor sentiment.
Read full news article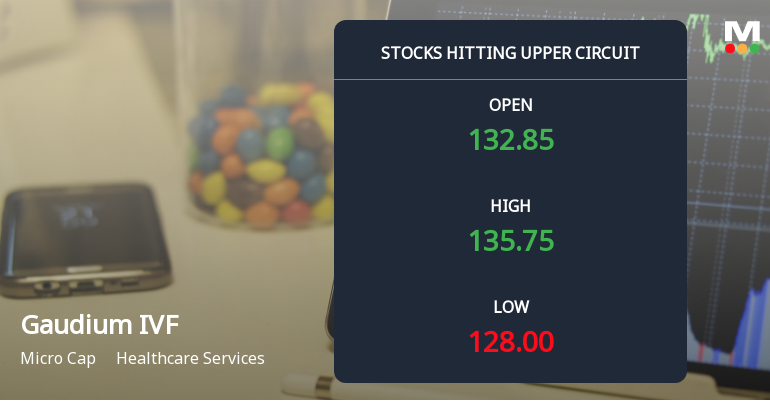
Gaudium IVF and Women Health Ltd Locks at Upper Circuit With 5.0% Gain — Buyers Queue, Sellers Absent
At Rs 136.52, the buying was done — not because demand dried up, but because the exchange wouldn't let the stock go any higher. Gaudium IVF and Women Health Ltd locked at its upper circuit of 5.0% on 14 Jul 2026, with buyers queuing and no sellers willing to part with shares.
Read full news article Announcements
Compliances-Certificate under Reg. 74 (5) of SEBI (DP) Regulations 2018
11-Jul-2026 | Source : BSECompliance Certificate under Regulation 74(5) of Securities and Exchange Board of India (Depositories and Participants) Regulations 2018 for the quarter ended June 30 2026
Closure of Trading Window
26-Jun-2026 | Source : BSEGaudium IVF and Women Health Limited has informed the Exchange regarding the Trading Window closure pursuant to SEBI (Prohibition of Insider Trading) Regulations 2015
Gaudium IVF And Women Health Limited Has Informed The Exchange About Corrigendum To The Financial Results Submitted For The Quarter And Year Ended March 31 2026
25-Jun-2026 | Source : BSEGaudium IVF and Women Health Limited has informed the Exchange about Corrigendum to the Financial Results submitted for the quarter and year ended March 31 2026
Corporate Actions

No Upcoming Board Meetings

No Dividend history available

No Splits history available

No Bonus history available

No Rights history available
Quality key factors
Valuation key factors
Technicals key factors
 Technical Indicator Scale: Bearish, Mildly Bearish, Sideways, Mildly Bullish, Bullish Turned
 Shareholding Snapshot : Jun 2026
Shareholding Compare (%holding)
Promoters
None
Held by 0 Schemes
Held by 9 FIIs (3.02%)
Manika Khanna (70.73%)
Gdn Ventures Llp (4.26%)
16.78%
Quarterly Results Snapshot (Standalone) - Mar'26 - QoQ

QoQ Growth in quarter ended Mar 2026 is 56.24% vs -38.17% in Dec 2025
QoQ Growth in quarter ended Mar 2026 is 143.08% vs -64.78% in Dec 2025
Annual Results Snapshot (Standalone) - Mar'26
YoY Growth in year ended Mar 2026 is 21.32% vs 12.98% in Mar 2025
YoY Growth in year ended Mar 2026 is 19.65% vs 11.96% in Mar 2025
About Gaudium IVF and Women Health Ltd

Company Coordinates


