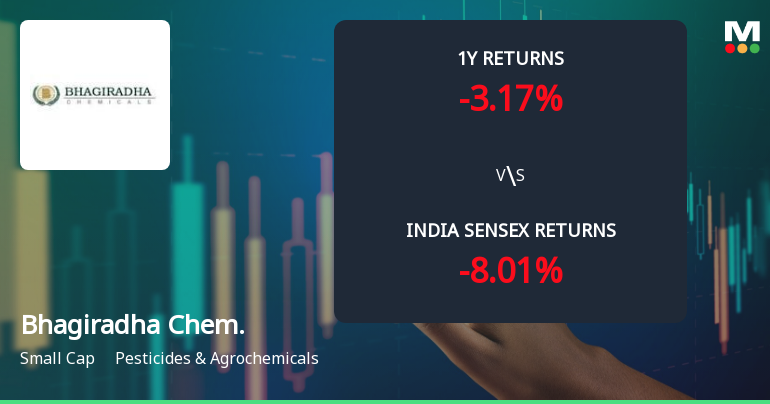
Bhagiradha Chem.

  • Market Cap: Small Cap
  • Industry: Pesticides & Agrochemicals
  • ISIN: INE414D01027
  • NSEID: BHAGCHEM
  • BSEID: 531719
INR
285.60
10.05 (3.65%)
BSENSE

Aug 07, 03:30 PM

BSE+NSE Vol: 2.49 lacs

  • Price Points
  • Score
  • Mojo Parameters
  • Total Return
  • News and Corporate Actions
  • Key factors
  • Shareholding
  • Financials
  • CompanyCV
stock-summaryPrice Point
High/Low

1Day

52 Week

Valuation
Technical
Day's Volume

CASH

2.49 lacs (-37.97%) Volume

Shareholding (Jun 2026)

FII

0.10%

Held by 11 FIIs

DII

3.00%

Held by 0 DIIs

Promoter

19.60%

Why is Bhagiradha Chemicals & Industries Ltd falling/rising?

06-Aug-2026

As of 06-Aug, Bhagiradha Chemicals & Industries Ltd's stock price is declining, currently at 275.55, down 2.2%. This decline is driven by reduced investor participation, poor long-term growth prospects, and valuation concerns, leading to a total drop of 7.78% over the past three days.

As of 06-Aug, Bhagiradha Chemicals & Industries Ltd is experiencing a decline in its stock price, currently at 275.55, reflecting a change of -6.2 (-2.2%). The stock has been underperforming, having fallen for the last three consecutive days, resulting in a total decline of -7.78% during this period. Additionally, the stock's performance today has underperformed its sector by -1.95%.<BR><BR>The stock's recent price movement can be attributed to several factors. Firstly, there has been a significant drop in investor participation, with delivery volume on 05 Aug falling by -61.92% compared to the 5-day average. This decline in trading activity suggests reduced interest from investors, which can contribute to downward pressure on the stock price.<BR><BR>Furthermore, while the company reported a strong growth in net profit of 227.52% and positive operating metrics in its latest results, the long-term growth outlook appears poor. Over the past five years, net sales have grown at an annual rate of only 11.33%, and operating profit has increased at a mere 2.60%. This lack of robust long-term growth may deter investors, leading to the stock's decline.<BR><BR>Additionally, despite the company's strong ability to service debt, indicated by a low Debt to EBITDA ratio, the stock is perceived as having a very expensive valuation with a Return on Capital Employed (ROCE) of 4. This valuation concern, coupled with the fact that domestic mutual funds hold 0% of the company, may signal a lack of confidence among institutional investors, further contributing to the stock's downward trend.<BR><BR>In summary, the combination of declining investor participation, poor long-term growth prospects, and valuation concerns are key factors contributing to the falling stock price of Bhagiradha Chemicals & Industries Ltd.

View full answer

Are Bhagiradha Chemicals & Industries Ltd latest results good or bad?

04-Aug-2026

Bhagiradha Chemicals & Industries Ltd reported strong Q1 FY27 results, with a net profit of ₹13.33 crores (up 234.92% year-on-year) and revenue of ₹195.02 crores (up 57.55%). However, the high price-to-earnings ratio of 213x and increased debt levels suggest caution for potential investors despite the positive performance.

Bhagiradha Chemicals & Industries Ltd has reported strong results for Q1 FY27, indicating a positive performance overall. The company achieved a net profit of ₹13.33 crores, which reflects a remarkable year-on-year increase of 234.92%. Additionally, revenue grew to ₹195.02 crores, marking a 57.55% increase compared to the same quarter last year.<BR><BR>The operating margin also improved significantly, reaching 15.65%, the highest in eight quarters, which demonstrates effective cost management and operational efficiency. Furthermore, the profit after tax margin increased to 6.84%, up from 3.22% in the previous year.<BR><BR>Despite these positive results, it's important to note that the company's valuation appears quite high, with a price-to-earnings ratio of 213x. This suggests that investors are expecting substantial future growth, which may be challenging to sustain consistently. <BR><BR>Overall, while the latest results show strong operational momentum and significant improvements in profitability, the elevated valuation and increased debt levels raise some caution for potential investors.

View full answer

Should I buy, sell or hold Bhagiradha Chemicals & Industries Ltd?

04-Aug-2026

How big is Bhagiradha Chem.?

11-Jun-2026

As of 10th June, Bhagiradha Chemicals & Industries Ltd has a market capitalization of 3,355.00 Cr, with recent net sales of 535.95 Cr and a net profit of 18.17 Cr over the last four quarters.

As of 10th June, <BR><BR>Market Cap: Bhagiradha Chemicals & Industries Ltd has a market capitalization of 3,355.00 Cr, categorizing it as a Small Cap company.<BR><BR>Recent Quarterly Performance: The sum of Net Sales for the latest 4 quarters is 535.95 Cr, while the sum of Net Profit for the same period is 18.17 Cr.<BR><BR>Balance Sheet Snapshot: The reporting period for the balance sheet is March 2025. Shareholder's Funds are valued at 682.22 Cr, and Total Assets amount to 933.15 Cr.

View full answer

Who are in the management team of Bhagiradha Chem.?

11-Jun-2026

The management team of Bhagiradha Chem includes K S Raju (Chairman), S Chandra Sekhar (Managing Director), and several directors and company secretaries, responsible for the company's operations and strategic direction.

The management team of Bhagiradha Chem includes the following individuals:<BR><BR>1. **K S Raju** - Chairman<BR>2. **Sudhakar Kudva** - Independent Director<BR>3. **S Chandra Sekhar** - Managing Director<BR>4. **D Sadasivudu** - Director<BR>5. **S Lalitha Sree** - Director<BR>6. **B N Suvarchala** - Company Secretary<BR>7. **A Lakshmi Sowjanya** - Additional Independent Director<BR>8. **GSV Krishna Rao** - Additional Independent Director<BR>9. **Ketan Chamanlal Budh** - Whole-time Director<BR>10. **Kishor Shah** - Additional Director<BR>11. **G Aruna** - Additional Director<BR>12. **Saheli Banerjee** - Company Secretary<BR>13. **Sharanya** - Company Secretary<BR><BR>This team is responsible for overseeing the operations and strategic direction of the company.

View full answer

Who are the peers of the Bhagiradha Chem.?

11-Jun-2026

Peers of Bhagiradha Chem. include Bayer CropSci., Sharda Cropchem, Dhanuka Agritech, Rallis India, NACL Industries, Bharat Rasayan, Insecticid.India, India Pesticides, and Astec Lifescienc. Bhagiradha Chem. has average management risk, good capital structure, and a 1-year return of -12.27%, better than Dhanuka Agritech but worse than Sharda Cropchem's 8.50%.

Peers: The peers of Bhagiradha Chem. are Bayer CropSci., Sharda Cropchem, Dhanuka Agritech, Rallis India, NACL Industries, Bharat Rasayan, Insecticid.India, India Pesticides, and Astec Lifescienc.<BR><BR>Quality Snapshot: Excellent management risk is observed at Bayer CropSci. and Dhanuka Agritech, while Good management risk is found at Sharda Cropchem. Average management risk is found at Rallis India, NACL Industries, Bhagiradha Chem., Bharat Rasayan, Insecticid.India, and India Pesticides. Below Average management risk is noted at Astec Lifescienc. Growth is Excellent at Sharda Cropchem, while Below Average growth is seen at Bayer CropSci., Dhanuka Agritech, Rallis India, NACL Industries, Bhagiradha Chem., Bharat Rasayan, Insecticid.India, and India Pesticides. Astec Lifescienc shows Below Average growth as well. Excellent capital structure is observed at Bayer CropSci., Sharda Cropchem, Dhanuka Agritech, Bharat Rasayan, Insecticid.India, and India Pesticides, while Good capital structure is found at Bhagiradha Chem. and Below Average capital structure is noted at NACL Industries and Astec Lifescienc.<BR><BR>Return Snapshot: The peer with the highest 1-year return is Sharda Cropchem at 8.50%, while the lowest is Dhanuka Agritech at -36.93%. Bhagiradha Chem.'s 1-year return of -12.27% is better than Dhanuka Agritech's but worse than Sharda Cropchem's. Additionally, Bharat Rasayan, Dhanuka Agritech, and Astec Lifescienc have negative six-month returns.

View full answer

What does Bhagiradha Chem. do?

10-Jun-2026

Bhagiradha Chemicals & Industries Ltd manufactures Crop Protection Chemicals and operates in the Small Cap segment of the Pesticides & Agrochemicals industry. As of March 2026, it reported net sales of ₹158 Cr and a net profit of ₹4 Cr, with a market cap of ₹3,355 Cr.

Overview: <BR>Bhagiradha Chemicals & Industries Ltd is engaged in the manufacture of Crop Protection Chemicals and operates within the Small Cap category in the Pesticides & Agrochemicals industry.<BR><BR>History: <BR>The company was incorporated on July 07, 1993. The latest quarterly results reported are for March 2026, showing net sales and profit figures.<BR><BR>Financial Snapshot: <BR>Net Sales: 158 Cr (Quarterly Results - Mar 2026) <BR>Net Profit: 4 Cr (Quarterly Results - Mar 2026) <BR>Market Cap: INR 3,355 Cr (Small Cap) <BR><BR>Key Metrics: <BR>P/E: 187.00 <BR>Industry P/E: 29 <BR>Dividend Yield: 0.06% <BR>Debt-Equity: 0.31 <BR>Return on Equity: 2.60% <BR>Price to Book: 4.83 <BR><BR>Contact Details: <BR>Address: 8-2-269/S/3/A Road No 2, Sagar Society Banjara Hills Hyderabad Telangana : 500034 <BR>Tel: 91-040-42221212 <BR>Email: info@bhagirad.com <BR>Website: http://www.bhagirad.com

View full answer

When is the next results date for Bhagiradha Chemicals & Industries Ltd?

07-May-2026

The next results date for Bhagiradha Chemicals & Industries Ltd is 19 May 2026.

The next results date for Bhagiradha Chemicals & Industries Ltd is scheduled for 19 May 2026.

View full answer

Is Bhagiradha Chem. technically bullish or bearish?

03-Dec-2025

As of December 2, 2025, Bhagiradha Chem. shows a bearish technical trend, indicated by a bearish MACD, Bollinger Bands, moving averages, and KST, reflecting significant market weakness.

As of 2 December 2025, the technical trend has changed from mildly bearish to bearish. The current technical stance for Bhagiradha Chem. is bearish with a strong indication of weakness. Key indicators driving this stance include a bearish MACD on the weekly chart, bearish Bollinger Bands on both weekly and monthly time frames, and bearish moving averages on the daily chart. The KST is also bearish on the weekly chart, while the Dow Theory presents a mildly bearish outlook on the weekly basis. Overall, the combination of these indicators suggests a significant bearish sentiment in the market.

View full answer

How has been the historical performance of Bhagiradha Chem.?

12-Nov-2025

Bhagiradha Chem. has shown fluctuating historical performance, with net sales increasing to 440.47 Cr in Mar'25 from 407.65 Cr in Mar'24, but profits declining across key metrics, including a drop in profit after tax to 13.86 Cr. The company also faced challenges in cash flow, reporting -52.00 Cr in operating activities for Mar'25.

Answer:<BR>The historical performance of Bhagiradha Chem. shows a fluctuating trend in net sales and profits over the years, with a notable decline in recent periods.<BR><BR>Breakdown:<BR>Bhagiradha Chem. reported net sales of 440.47 Cr in Mar'25, an increase from 407.65 Cr in Mar'24, but a decline from 502.09 Cr in Mar'23. The total operating income followed a similar pattern, reaching 440.47 Cr in Mar'25, up from 407.65 Cr in Mar'24, yet down from 502.09 Cr in Mar'23. The raw material cost increased to 279.01 Cr in Mar'25 from 272.29 Cr in Mar'24, while total expenditure rose to 403.53 Cr in Mar'25 from 364.73 Cr in Mar'24. Operating profit (PBDIT) was 36.94 Cr in Mar'25, down from 42.92 Cr in Mar'24, and profit before tax decreased to 25.25 Cr from 26.92 Cr in the same period. Profit after tax also fell to 13.86 Cr in Mar'25 from 18.22 Cr in Mar'24. The company's total assets grew significantly to 933.15 Cr in Mar'25 from 576.04 Cr in Mar'24, while total liabilities also increased to 933.15 Cr from 576.04 Cr. Cash flow from operating activities showed a negative trend, with -52.00 Cr in Mar'25 compared to 34.00 Cr in Mar'24, indicating challenges in generating cash from operations. Overall, the financial metrics reflect a mixed performance with growth in sales and assets but declining profitability and cash flow.

View full answer

Who are the top shareholders of the Bhagiradha Chem.?

17-Jul-2025

The top shareholders of Bhagiradha Chem. include promoter Singavarapu Chandrasekhar with 12.9% and public shareholder Ratnabali Investment Private Limited with 14.07%. Individual investors hold 29.79% of shares, with no pledged promoter holdings and 7 foreign institutional investors holding 0.04%.

The top shareholders of Bhagiradha Chem. include Singavarapu Chandrasekhar, who is the promoter with the highest holding at 12.9%. The largest public shareholder is Ratnabali Investment Private Limited, holding 14.07%. Additionally, individual investors collectively hold 29.79% of the company's shares. It's also worth noting that there are no pledged promoter holdings and that the company has 7 foreign institutional investors (FIIs) holding a total of 0.04%.

View full answer

Is Bhagiradha Chem. overvalued or undervalued?

09-Jun-2025

As of April 1, 2024, Bhagiradha Chemicals is considered very expensive and overvalued, with a PE ratio of 279.78 and significantly higher valuation metrics compared to peers like UPL, which has a PE ratio of 38.74.

As of 1 April 2024, the valuation grade for Bhagiradha Chemicals has moved from expensive to very expensive. The company is currently overvalued, with a PE ratio of 279.78, an EV to EBITDA of 106.55, and a Price to Book Value of 5.68. These figures significantly exceed those of its peers, such as UPL, which has a PE ratio of 38.74 and an EV to EBITDA of 8.35, indicating a stark contrast in valuation metrics.<BR><BR>In comparison to other companies in the pesticides and agrochemicals sector, Bhagiradha Chem. stands out with its extremely high valuation ratios, particularly the PE ratio, which is more than seven times that of its closest peer, UPL. Additionally, the company's return metrics, while impressive over the long term, do not justify its current valuation levels, reinforcing the conclusion that it is overvalued in the current market context.

View full answer

Has Bhagiradha Chem. declared dividend?

06-Jun-2025

Yes, Bhagiradha Chemicals & Industries Ltd has declared a 10% dividend, amounting to ₹0.10 per share, with an ex-date of 02 Aug 2024. While recent performance shows mixed returns, long-term growth has been significant, particularly with a total return of 1067.61% over the past 5 years.

Bhagiradha Chemicals & Industries Ltd has declared a 10% dividend.<BR><BR>Dividend Details:<BR>- Percentage announced: 10%<BR>- Amount per share: ₹0.10<BR>- Ex-date: 02 Aug 2024<BR><BR>Dividend Yield: 0.03%.<BR><BR>Total Returns by Period:<BR>In the last 6 months, the price return was -13.71%, with a dividend return of 0%, resulting in a total return of -13.71%.<BR><BR>Over the past year, the price return was 23.14%, the dividend return was 0.04%, leading to a total return of 23.18%.<BR><BR>In the 2-year period, the price return reached 86.05%, with a dividend return of 2.00%, culminating in a total return of 88.05%.<BR><BR>For the 3-year period, the price return was 230.84%, the dividend return was 6.76%, resulting in a total return of 237.6%.<BR><BR>In the last 4 years, the price return was 490.65%, with a dividend return of 11.33%, leading to a total return of 501.98%.<BR><BR>Over the 5-year period, the price return was 1043.16%, with a dividend return of 24.45%, resulting in a total return of 1067.61%.<BR><BR>Overall, Bhagiradha Chemicals has declared a dividend, and while the recent performance shows mixed returns, the long-term returns indicate significant growth, particularly over the 5-year period.

View full answer
iScoreScore
Click here to find our call on this stock
Strong Sell
Sell
Hold
Buy
Strong Buy

Dashboard

1

Strong ability to service debt as the company has a low Debt to EBITDA ratio of 4.10 times

 
2

With a growth in Net Profit of 227.52%, the company declared Very Positive results in Jun 26

stock-summaryMojo Parameters

Mojo Parameters

Loading Valuation Snapshot...

Stock DNA

stock-summary
Industry

Pesticides & Agrochemicals

stock-summary
Market cap

INR 3,552 Cr (Small Cap)

stock-summary
P/E

130.00

stock-summary
Industry P/E

27

stock-summary
Dividend Yield

0.11%

stock-summary
Debt Equity

0.31

stock-summary
Return on Equity

2.60%

stock-summary
Price to Book

5.11

Revenue and Profits:
Net Sales:
195 Cr
(Quarterly Results - Jun 2026)
Net Profit:
13 Cr
stock-summaryTotal Returns
Total Returns (Price + Dividend) stock-summary
Dividend Yield (0.11%)
TimePeriod
Price Return
Dividend Return
Total Return
3 Months
9.22%
0.06%
9.28%
6 Months
27.84%
0.06%
27.9%
1 Year
-3.37%
0.11%
-3.26%
2 Years
-18.93%
0.08%
-18.85%
3 Years
135.88%
0.33%
136.21%
4 Years
130.36%
0.61%
130.97%
5 Years
371.05%
1.87%
372.92%

Latest dividend: 0.15 per share ex-dividend date: Jul-23-2026

Risk Adjusted Returns v/s stock-summary
Returns Beta
Icon
Beta has not been calculated since enough price history is not available
stock-summaryNews & Corporate Actions

News

Announcements stock-summary

Announcement under Regulation 30 (LODR)-Newspaper Publication

04-Aug-2026 | Source : BSE

Newspaper Publication of Unaudited Financial Results for the quarter ended June 30 2026

Board Meeting Outcome for Outcome Of Board Meeting Dated August 03 2026

03-Aug-2026 | Source : BSE

Outcome of Board Meeting dated August 03 2026

Unaudited Financial Results For The Quarter Ended June 30 2026

03-Aug-2026 | Source : BSE

Unaudited Financial Results for the quarter ended June 30 2026

Corporate Actions stock-summary

stock-summary
BOARD MEETING

No Upcoming Board Meetings

stock-summary
DIVIDEND

Bhagiradha Chemicals & Industries Ltd has declared 15% dividend, ex-date: 23 Jul 26

stock-summary
SPLITS

Bhagiradha Chemicals & Industries Ltd has announced 1:10 stock split, ex-date: 02 May 24

stock-summary
BONUS

No Bonus history available

stock-summary
RIGHTS

Bhagiradha Chemicals & Industries Ltd has announced 4:17 rights issue, ex-date: 07 Apr 22

stock-summaryKey Factors

Quality key factors stock-summary

Factor
Value
Sales Growth (5y)
11.33%
EBIT Growth (5y)
2.60%
EBIT to Interest (avg)
5.62
Debt to EBITDA (avg)
1.95
Net Debt to Equity (avg)
0.31
Sales to Capital Employed (avg)
1.04
Tax Ratio
23.85%
Dividend Payout Ratio
14.04%
Pledged Shares
0
Institutional Holding
3.09%
ROCE (avg)
11.89%
ROE (avg)
8.46%

Valuation key factors

Factor
Value
P/E Ratio
130
Industry P/E
27
Price to Book Value
5.11
EV to EBIT
70.95
EV to EBITDA
48.04
EV to Capital Employed
4.14
EV to Sales
6.23
PEG Ratio
1.02
Dividend Yield
0.11%
ROCE (Latest)
3.96%
ROE (Latest)
2.60%

Technicals key factors

Indicator
Weekly
Monthly
MACD
Bullish
Bullish
RSI
No Signal
Bearish
Bollinger Bands
Mildly Bullish
Mildly Bullish
Moving Averages
Bullish (Daily)
KST
Bullish
Bearish
Dow Theory
Mildly Bullish
Mildly Bullish
OBV
Bullish
Bullish
stock-summary Technical Indicator Scale: Bearish, Mildly Bearish, Sideways, Mildly Bullish, Bullish  Turned 
stock-summaryShareholding
Shareholding Snapshot : Jun 2026stock-summary
Shareholding Compare (%holding) stock-summary
Majority shareholders

Non Institution

Pledged Promoter Holdings

None

Mutual Funds

Held by 0 Schemes

FIIs

Held by 11 FIIs (0.1%)

Promoter with highest holding

Singavarapu Chandrasekhar (12.9%)

Highest Public shareholder

Ratnabali Investment Private Limited (14.07%)

Individual Investors Holdings

32.16%

stock-summaryFinancial
[
  {
    "link": "quarterly",
    "btn_text": "All Quarterly Results",
    "header": "Quarterly Results Snapshot (Consolidated) - Jun'26 - QoQ",
    "rhs": [
      {
        "prefix": "Net Sales ",
        "suffix": "QoQ Growth in quarter ended Jun 2026 is 23.35% vs 38.72% in Mar 2026",
        "dir": -1
      },
      {
        "prefix": "Consolidated Net Profit ",
        "suffix": "QoQ Growth in quarter ended Jun 2026 is 227.52% vs -11.90% in Mar 2026",
        "dir": 1
      }
    ],
    "table": {
      "header": [
        "Jun'26",
        "Mar'26",
        "Change(%)"
      ],
      "body": [
        {
          "field": "Net Sales",
          "val1": "195.02",
          "val2": "158.10",
          "chgp": "23.35%",
          "chgp_class": "positive"
        },
        {
          "field": "Operating Profit (PBDIT) excl Other Income",
          "val1": "30.53",
          "val2": "19.43",
          "chgp": "57.13%",
          "chgp_class": "positive"
        },
        {
          "field": "Interest",
          "val1": "6.43",
          "val2": "7.05",
          "chgp": "-8.79%",
          "chgp_class": "positive"
        },
        {
          "field": "Exceptional Items",
          "val1": "0.00",
          "val2": "0.00",
          "chgp": "",
          "chgp_class": "neutral"
        },
        {
          "field": "Consolidate Net Profit",
          "val1": "13.33",
          "val2": "4.07",
          "chgp": "227.52%",
          "chgp_class": "positive"
        },
        {
          "field": "Operating Profit Margin (Excl OI)",
          "val1": "15.65%",
          "val2": "12.29%",
          "chgp": "3.36%",
          "chgp_class": "positive"
        }
      ]
    }
  },
  {
    "link": "half-yearly",
    "btn_text": "All Half Yearly Results",
    "header": "Half Yearly Results Snapshot (Consolidated) - Sep'25",
    "rhs": [
      {
        "prefix": "Net Sales ",
        "suffix": " Growth in half year ended Sep 2025 is 22.67% vs -3.11% in Sep 2024",
        "dir": 1
      },
      {
        "prefix": "Consolidated Net Profit ",
        "suffix": " Growth in half year ended Sep 2025 is -14.98% vs 44.99% in Sep 2024",
        "dir": -1
      }
    ],
    "table": {
      "header": [
        "Sep'25",
        "Sep'24",
        "Change(%)"
      ],
      "body": [
        {
          "field": "Net Sales",
          "val1": "263.88",
          "val2": "215.12",
          "chgp": "22.67%",
          "chgp_class": "positive"
        },
        {
          "field": "Operating Profit (PBDIT) excl Other Income",
          "val1": "24.05",
          "val2": "21.71",
          "chgp": "10.78%",
          "chgp_class": "positive"
        },
        {
          "field": "Interest",
          "val1": "7.32",
          "val2": "3.11",
          "chgp": "135.37%",
          "chgp_class": "negative"
        },
        {
          "field": "Exceptional Items",
          "val1": "0.00",
          "val2": "0.00",
          "chgp": "",
          "chgp_class": "neutral"
        },
        {
          "field": "Consolidate Net Profit",
          "val1": "9.48",
          "val2": "11.15",
          "chgp": "-14.98%",
          "chgp_class": "negative"
        },
        {
          "field": "Operating Profit Margin (Excl OI)",
          "val1": "9.11%",
          "val2": "10.09%",
          "chgp": "-0.98%",
          "chgp_class": "negative"
        }
      ]
    }
  },
  {
    "link": "nine-monthly",
    "btn_text": "All Nine Monthly Results",
    "header": "Nine Monthly Results Snapshot (Consolidated) - Dec'25",
    "rhs": [
      {
        "prefix": "Net Sales ",
        "suffix": "YoY Growth in nine months ended Dec 2025 is 18.88% vs 7.24% in Dec 2024",
        "dir": 1
      },
      {
        "prefix": "Consolidated Net Profit ",
        "suffix": "YoY Growth in nine months ended Dec 2025 is -4.34% vs 33.88% in Dec 2024",
        "dir": -1
      }
    ],
    "table": {
      "header": [
        "Dec'25",
        "Dec'24",
        "Change(%)"
      ],
      "body": [
        {
          "field": "Net Sales",
          "val1": "377.85",
          "val2": "317.85",
          "chgp": "18.88%",
          "chgp_class": "positive"
        },
        {
          "field": "Operating Profit (PBDIT) excl Other Income",
          "val1": "37.73",
          "val2": "30.87",
          "chgp": "22.22%",
          "chgp_class": "positive"
        },
        {
          "field": "Interest",
          "val1": "10.42",
          "val2": "5.56",
          "chgp": "87.41%",
          "chgp_class": "negative"
        },
        {
          "field": "Exceptional Items",
          "val1": "0.00",
          "val2": "0.00",
          "chgp": "",
          "chgp_class": "neutral"
        },
        {
          "field": "Consolidate Net Profit",
          "val1": "14.10",
          "val2": "14.74",
          "chgp": "-4.34%",
          "chgp_class": "negative"
        },
        {
          "field": "Operating Profit Margin (Excl OI)",
          "val1": "9.99%",
          "val2": "9.71%",
          "chgp": "0.28%",
          "chgp_class": "positive"
        }
      ]
    }
  },
  {
    "link": "annual",
    "btn_text": "All Annual Results",
    "header": "Annual Results Snapshot (Consolidated) - Mar'26",
    "rhs": [
      {
        "prefix": "Net Sales ",
        "suffix": "YoY Growth in year ended Mar 2026 is 21.67% vs 8.05% in Mar 2025",
        "dir": 1
      },
      {
        "prefix": "Consolidated Net Profit ",
        "suffix": "YoY Growth in year ended Mar 2026 is 31.10% vs -23.93% in Mar 2025",
        "dir": 1
      }
    ],
    "table": {
      "header": [
        "Mar'26",
        "Mar'25",
        "Change(%)"
      ],
      "body": [
        {
          "field": "Net Sales",
          "val1": "535.94",
          "val2": "440.47",
          "chgp": "21.67%",
          "chgp_class": "positive"
        },
        {
          "field": "Operating Profit (PBDIT) excl Other Income",
          "val1": "57.13",
          "val2": "36.94",
          "chgp": "54.66%",
          "chgp_class": "positive"
        },
        {
          "field": "Interest",
          "val1": "17.46",
          "val2": "7.11",
          "chgp": "145.57%",
          "chgp_class": "negative"
        },
        {
          "field": "Exceptional Items",
          "val1": "0.00",
          "val2": "0.00",
          "chgp": "",
          "chgp_class": "neutral"
        },
        {
          "field": "Consolidate Net Profit",
          "val1": "18.17",
          "val2": "13.86",
          "chgp": "31.10%",
          "chgp_class": "positive"
        },
        {
          "field": "Operating Profit Margin (Excl OI)",
          "val1": "10.66%",
          "val2": "8.39%",
          "chgp": "2.27%",
          "chgp_class": "positive"
        }
      ]
    }
  }
]

Quarterly Results Snapshot (Consolidated) - Jun'26 - QoQstock-summary

Jun'26
Mar'26
Change(%)
Net Sales
195.02
158.10
23.35%
Operating Profit (PBDIT) excl Other Income
30.53
19.43
57.13%
Interest
6.43
7.05
-8.79%
Exceptional Items
0.00
0.00
Consolidate Net Profit
13.33
4.07
227.52%
Operating Profit Margin (Excl OI)
15.65%
12.29%
3.36%
Values in Rs Cr.
Direction Arrows
Net Sales

QoQ Growth in quarter ended Jun 2026 is 23.35% vs 38.72% in Mar 2026

Direction Arrows
Consolidated Net Profit

QoQ Growth in quarter ended Jun 2026 is 227.52% vs -11.90% in Mar 2026

Half Yearly Results Snapshot (Consolidated) - Sep'25stock-summary

Sep'25
Sep'24
Change(%)
Net Sales
263.88
215.12
22.67%
Operating Profit (PBDIT) excl Other Income
24.05
21.71
10.78%
Interest
7.32
3.11
135.37%
Exceptional Items
0.00
0.00
Consolidate Net Profit
9.48
11.15
-14.98%
Operating Profit Margin (Excl OI)
9.11%
10.09%
-0.98%
Values in Rs Cr.
Direction Arrows
Net Sales

Growth in half year ended Sep 2025 is 22.67% vs -3.11% in Sep 2024

Direction Arrows
Consolidated Net Profit

Growth in half year ended Sep 2025 is -14.98% vs 44.99% in Sep 2024

Nine Monthly Results Snapshot (Consolidated) - Dec'25stock-summary

Dec'25
Dec'24
Change(%)
Net Sales
377.85
317.85
18.88%
Operating Profit (PBDIT) excl Other Income
37.73
30.87
22.22%
Interest
10.42
5.56
87.41%
Exceptional Items
0.00
0.00
Consolidate Net Profit
14.10
14.74
-4.34%
Operating Profit Margin (Excl OI)
9.99%
9.71%
0.28%
Values in Rs Cr.
Direction Arrows
Net Sales

YoY Growth in nine months ended Dec 2025 is 18.88% vs 7.24% in Dec 2024

Direction Arrows
Consolidated Net Profit

YoY Growth in nine months ended Dec 2025 is -4.34% vs 33.88% in Dec 2024

Annual Results Snapshot (Consolidated) - Mar'26stock-summary

Mar'26
Mar'25
Change(%)
Net Sales
535.94
440.47
21.67%
Operating Profit (PBDIT) excl Other Income
57.13
36.94
54.66%
Interest
17.46
7.11
145.57%
Exceptional Items
0.00
0.00
Consolidate Net Profit
18.17
13.86
31.10%
Operating Profit Margin (Excl OI)
10.66%
8.39%
2.27%
Values in Rs Cr.
Direction Arrows
Net Sales

YoY Growth in year ended Mar 2026 is 21.67% vs 8.05% in Mar 2025

Direction Arrows
Consolidated Net Profit

YoY Growth in year ended Mar 2026 is 31.10% vs -23.93% in Mar 2025

stock-summaryCompany CV
About Bhagiradha Chemicals & Industries Ltd stock-summary
stock-summary
Bhagiradha Chemicals & Industries Ltd
Small Cap
Pesticides & Agrochemicals
Bhagiradha Chemicals and Industries Limited was incorporated on July 7, 1993. Company has got its manufacturing facility in Ongole, Prakasam District of Andhra Pradesh and presently manufactures Crop Protection Chemicals. The company set up a plant at Cheruvukommupalem, Andhra Pradesh, to manufacture 300 tons per annum of pesticides like technical grade chlorpyriphos. The project was financed through a public issue in 1996 and commissioned in 1996.
Company Coordinates stock-summary
Company Details
8-2-269/S/3/A Road No 2, Sagar Society Banjara Hills Hyderabad Telangana : 500034
stock-summary
Tel: 91-040-42221212
stock-summary
info@bhagirad.com
Registrar Details
XL Softech Systems Ltd , 3 Sagar Society Road , No 2 Banjara Hills, Hyderabad