
Compare Sh. Ajit Pulp with Similar Stocks
Dashboard
Weak Long Term Fundamental Strength with an average Return on Capital Employed (ROCE) of 9.40%
- Poor long term growth as Operating profit has grown by an annual rate 14.24% of over the last 5 years
- Low ability to service debt as the company has a high Debt to EBITDA ratio of 2.74 times
The company has declared Positive results for the last 5 consecutive quarters
With ROCE of 13.9, it has a Very Attractive valuation with a 0.9 Enterprise value to Capital Employed
Majority shareholders : Promoters
Market Beating performance in long term as well as near term
Stock DNA
Paper, Forest & Jute Products
INR 294 Cr (Micro Cap)
8.00
17
0.00%
0.00
0.00%
0.89
Total Returns (Price + Dividend) 
Latest dividend: 0.6757684931506849 per share ex-dividend date: Jul-27-2023
Risk Adjusted Returns v/s
Returns Beta

News
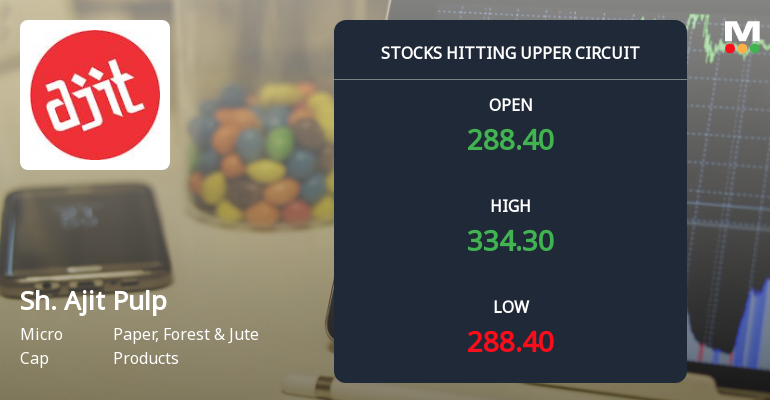
Micro-Cap Shree Ajit Pulp and Paper Ltd Locks at Upper Circuit — Rs 0.37 Crore Turnover and Delivery Decline Highlight Thin Liquidity
At Rs 321.0, the buying was done — not because demand dried up, but because the exchange would not allow the stock to rise further. Shree Ajit Pulp and Paper Ltd locked at its upper circuit of 19.96% on 09 Jul 2026, with buyers queuing and no sellers willing to part with shares, reflecting unfilled demand at the ceiling price.
Read full news article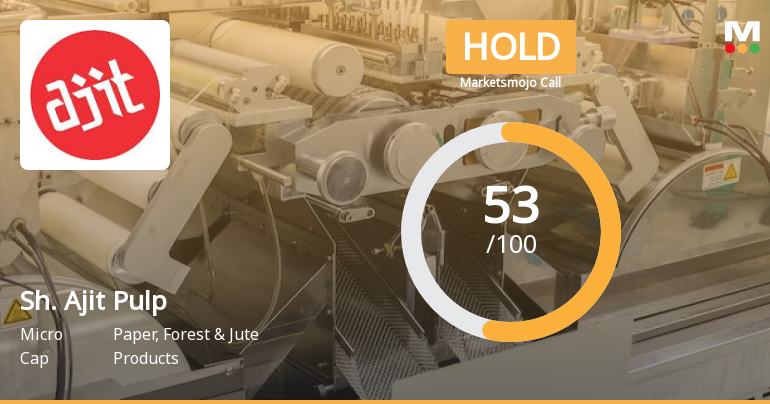
Shree Ajit Pulp and Paper Ltd is Rated Hold
Shree Ajit Pulp and Paper Ltd is rated 'Hold' by MarketsMOJO, with this rating last updated on 01 June 2026. However, the analysis and financial metrics discussed here reflect the stock's current position as of 05 July 2026, providing investors with an up-to-date view of the company’s fundamentals, valuation, financial trends, and technical outlook.
Read full news article
Shree Ajit Pulp and Paper Ltd is Rated Hold
Shree Ajit Pulp and Paper Ltd is rated 'Hold' by MarketsMOJO, with this rating last updated on 01 June 2026. However, the analysis and financial metrics discussed here reflect the stock's current position as of 24 June 2026, providing investors with the latest insights into its performance and outlook.
Read full news article Announcements
Closure of Trading Window
22-Jun-2026 | Source : BSEwe wish to inform you that SEBI (Prohibition of Insider Trading) Regulation 2015 trading window of the company for all the Directors KMPs / officers designated employees and their immediate relatives will remain closed from 1st July 2026 till the end of 48 hours after the declaration of financial results for the quarter ended on 30th June 2026.
Announcement under Regulation 30 (LODR)-Newspaper Publication
01-Jun-2026 | Source : BSENewspaper publication pursuant to Regulation 47 of SEBI (LoDR) Regulations 2015.
Compliances-Reg.24(A)-Annual Secretarial Compliance
30-May-2026 | Source : BSEPursuant to Regulation 24A of the SEBI (Listing Obligation and Disclosure Requirement) Regulations 2015 please find enclosed the Annual Secretarial Compliance Report of our company for the year ended 31st march 2026.
Corporate Actions

No Upcoming Board Meetings

Shree Ajit Pulp and Paper Ltd has declared 10% dividend, ex-date: 27 Jul 23

No Splits history available

No Bonus history available

Shree Ajit Pulp and Paper Ltd has announced 2:3 rights issue, ex-date: 18 Jan 24
Quality key factors
Valuation key factors
Technicals key factors
 Technical Indicator Scale: Bearish, Mildly Bearish, Sideways, Mildly Bullish, Bullish Turned
 Shareholding Snapshot : Mar 2026
Shareholding Compare (%holding)
Promoters
None
Held by 0 Schemes
Held by 0 FIIs
Gautam D Shah (20.79%)
Mayur Jayantilal Shah (9.2%)
35.37%
Quarterly Results Snapshot (Consolidated) - Mar'26 - QoQ

QoQ Growth in quarter ended Mar 2026 is -1.28% vs 2.50% in Dec 2025
QoQ Growth in quarter ended Mar 2026 is 27.62% vs 28.94% in Dec 2025
Half Yearly Results Snapshot (Consolidated) - Sep'25
Growth in half year ended Sep 2025 is 52.19% vs 59.55% in Sep 2024

Growth in half year ended Sep 2025 is 262.64% vs -6.56% in Sep 2024
Nine Monthly Results Snapshot (Consolidated) - Dec'25
YoY Growth in nine months ended Dec 2025 is 50.21% vs 87.37% in Dec 2024
YoY Growth in nine months ended Dec 2025 is 277.12% vs 0.37% in Dec 2024
Annual Results Snapshot (Consolidated) - Mar'26
YoY Growth in year ended Mar 2026 is 38.66% vs 71.64% in Mar 2025
YoY Growth in year ended Mar 2026 is 219.00% vs 14.18% in Mar 2025
About Shree Ajit Pulp and Paper Ltd

Company Coordinates


