
Compare Jagatjit Inds. with Similar Stocks
Dashboard
With HIgh Debt (Debt-Equity Ratio at 5.73 times)- the company has a Weak Long Term Fundamental Strength
- Poor long term growth as Operating profit has grown by an annual rate 17.66% of over the last 5 years
- High Debt Company with a Debt to Equity ratio (avg) of 3.59 times
- The company has been able to generate a Return on Equity (avg) of 4.19% signifying low profitability per unit of shareholders funds
Flat results in Mar 26
Risky - Negative EBITDA
Despite the size of the company, domestic mutual funds hold only 0.13% of the company
Total Returns (Price + Dividend) 
Jagatjit Inds. for the last several years.
Risk Adjusted Returns v/s
Returns Beta

News

Jagatjit Industries Ltd is Rated Strong Sell
Jagatjit Industries Ltd is rated Strong Sell by MarketsMOJO, with this rating last updated on 16 Dec 2024. However, the analysis and financial metrics discussed here reflect the stock’s current position as of 01 July 2026, providing investors with an up-to-date view of the company’s fundamentals, valuation, financial trend, and technical outlook.
Read full news article
Jagatjit Industries Ltd is Rated Strong Sell
Jagatjit Industries Ltd is rated Strong Sell by MarketsMOJO, with this rating last updated on 16 December 2024. However, the analysis and financial metrics discussed here reflect the company’s current position as of 20 June 2026, providing investors with an up-to-date perspective on its fundamentals, valuation, financial trends, and technical outlook.
Read full news article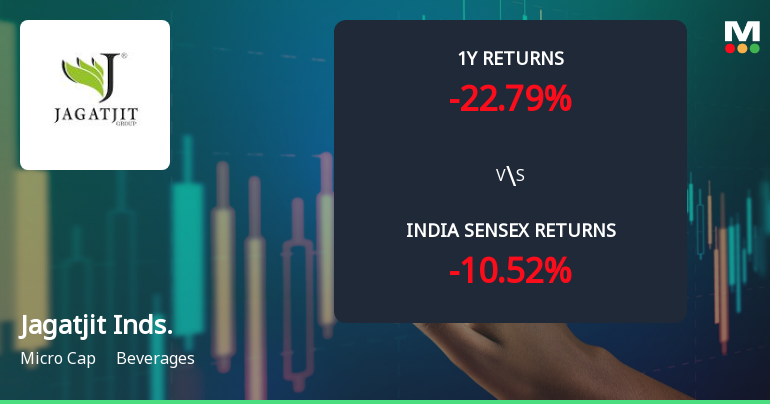
Jagatjit Industries Ltd Technical Momentum Shifts Amid Mixed Market Signals
Jagatjit Industries Ltd, a micro-cap player in the beverages sector, has experienced a nuanced shift in its technical momentum, reflecting a complex interplay of bullish and bearish signals across multiple timeframes. Despite a modest day gain of 1.94%, the stock remains under pressure with a strong sell mojo grade, highlighting the challenges ahead for investors.
Read full news article Announcements
Closure of Trading Window
24-Jun-2026 | Source : BSEIntimation regarding closure of Trading Window
Announcement under Regulation 30 (LODR)-Newspaper Publication
01-Jun-2026 | Source : BSEPublication of financial results for the quarter and year ended on 31.03.2026.
Integrated Filing (Financial) For The Quarter And Year Ended 31St March 2026
28-May-2026 | Source : BSEIntegrated Filing (Financial) for the quarter and yeawr ended 31st March 2026
Corporate Actions

No Upcoming Board Meetings

No Dividend history available

No Splits history available

No Bonus history available

No Rights history available
Quality key factors
Valuation key factors
Technicals key factors
 Technical Indicator Scale: Bearish, Mildly Bearish, Sideways, Mildly Bullish, Bullish Turned
 Shareholding Snapshot : Mar 2026
Shareholding Compare (%holding)
Promoters
None
Held by 5 Schemes (0.02%)
Held by 1 FIIs (0.0%)
Mr. Karamjit Jaiswal (56.06%)
None
9.59%
Quarterly Results Snapshot (Consolidated) - Mar'26 - QoQ

QoQ Growth in quarter ended Mar 2026 is 229.43% vs -64.45% in Dec 2025

QoQ Growth in quarter ended Mar 2026 is -125.92% vs 330.74% in Dec 2025
Half Yearly Results Snapshot (Consolidated) - Sep'25
Growth in half year ended Sep 2025 is -39.83% vs -7.03% in Sep 2024
Growth in half year ended Sep 2025 is -207.40% vs -345.02% in Sep 2024
Nine Monthly Results Snapshot (Consolidated) - Dec'25
YoY Growth in nine months ended Dec 2025 is -52.72% vs -11.97% in Dec 2024
YoY Growth in nine months ended Dec 2025 is 259.89% vs -394.86% in Dec 2024
Annual Results Snapshot (Consolidated) - Mar'26
YoY Growth in year ended Mar 2026 is -48.42% vs -11.83% in Mar 2025
YoY Growth in year ended Mar 2026 is 142.17% vs -408.96% in Mar 2025
About Jagatjit Industries Ltd

Company Coordinates


