
Compare Hemang Resources with Similar Stocks
Dashboard
With a Operating Losses, the company has a Weak Long Term Fundamental Strength
- Low ability to service debt as the company has a high Debt to EBITDA ratio of -1.28 times
Flat results in Mar 26
Risky - Negative EBITDA
Consistent Underperformance against the benchmark over the last 3 years
Stock DNA
Trading & Distributors
INR 18 Cr (Micro Cap)
NA (Loss Making)
23
0.00%
0.03
-1.77%
0.78
Total Returns (Price + Dividend) 
Latest dividend: 0.5 per share ex-dividend date: Aug-21-2014
Risk Adjusted Returns v/s
Returns Beta

News
When is the next results date for Hemang Resources Ltd?
The next results date for Hemang Resources Ltd is scheduled for 27 May 2026....
Read full news article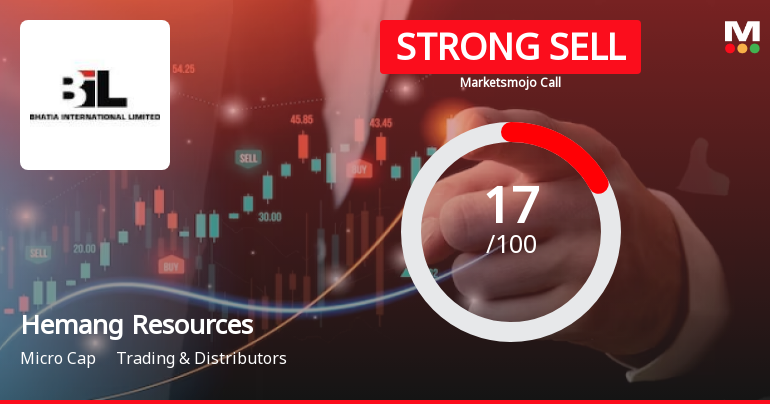
Hemang Resources Ltd is Rated Strong Sell
Hemang Resources Ltd is rated Strong Sell by MarketsMOJO, with this rating last updated on 26 February 2024. However, the analysis and financial metrics presented here reflect the stock’s current position as of 17 April 2026, providing investors with an up-to-date view of the company’s fundamentals, valuation, financial trends, and technical outlook.
Read full news article
Announcements
Announcement under Regulation 30 (LODR)-Newspaper Publication
28-May-2026 | Source : BSESubmission of Newspaper Publication of Audited Financials Results for the Quarter and Year ended on 31.03.2026
Audited Financial Results For The Quarter And Year Ended 31.03.2026
28-May-2026 | Source : BSEAudited Financial Results for the Quarter and the Year ended on 31.03.2026
Audited Financial Results For The Quarter And Year Ended 31.03.2026
28-May-2026 | Source : BSEAudited Financial Results for the Quarter and the Year ended on 31.03.2026
Corporate Actions

No Upcoming Board Meetings

Hemang Resources Ltd has declared 5% dividend, ex-date: 21 Aug 14

No Splits history available

Hemang Resources Ltd has announced 3:1 bonus issue, ex-date: 14 Jul 11

No Rights history available
Quality key factors
Valuation key factors
Technicals key factors
 Technical Indicator Scale: Bearish, Mildly Bearish, Sideways, Mildly Bullish, Bullish Turned
 Shareholding Snapshot : Mar 2026
Shareholding Compare (%holding)
Promoters
None
Held by 0 Schemes
Held by 0 FIIs
Surinder Singh Bhatia (14.08%)
Kulwant Singh Bhatia (4.72%)
25.89%
Quarterly Results Snapshot (Standalone) - Dec'25 - QoQ

QoQ Growth in quarter ended Dec 2025 is 0.00% vs -100.00% in Sep 2025
QoQ Growth in quarter ended Dec 2025 is 18.18% vs -140.74% in Sep 2025
Half Yearly Results Snapshot (Standalone) - Sep'25
Growth in half year ended Sep 2025 is -2.36% vs -95.74% in Sep 2024
Growth in half year ended Sep 2025 is 161.54% vs 95.80% in Sep 2024
Nine Monthly Results Snapshot (Standalone) - Dec'25
YoY Growth in nine months ended Dec 2025 is -2.36% vs -95.80% in Dec 2024
YoY Growth in nine months ended Dec 2025 is 160.87% vs 98.29% in Dec 2024
Annual Results Snapshot (Standalone) - Mar'26
YoY Growth in year ended Mar 2026 is -8.18% vs -76.29% in Mar 2025

YoY Growth in year ended Mar 2026 is -179.63% vs 149.54% in Mar 2025
About Hemang Resources Ltd

Company Coordinates


