
Compare Prima Agro with Similar Stocks
Dashboard
With a Operating Losses, the company has a Weak Long Term Fundamental Strength
- Company's ability to service its debt is weak with a poor EBIT to Interest (avg) ratio of 0.24
Flat results in Mar 26
Risky - Negative EBITDA
Consistent Underperformance against the benchmark over the last 3 years
Stock DNA
Other Agricultural Products
INR 7 Cr (Micro Cap)
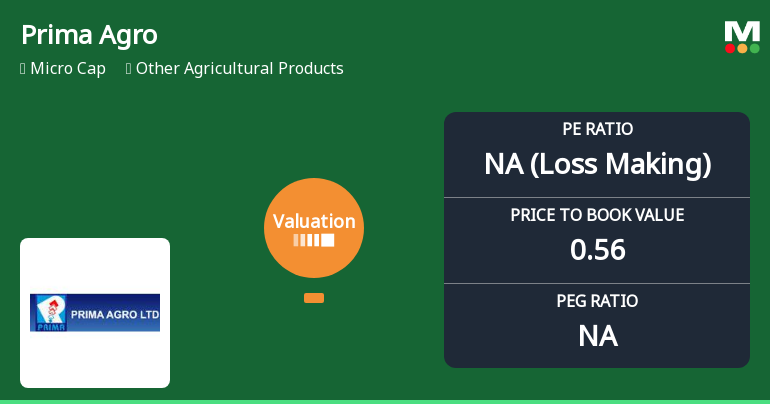
NA (Loss Making)
20
0.00%
-0.47
-0.38%
0.44
Total Returns (Price + Dividend) 
Prima Agro for the last several years.
Risk Adjusted Returns v/s
Returns Beta

News
Prima Agro Ltd Valuation Shifts Signal Elevated Risk Amidst Market Challenges
Prima Agro Ltd, a micro-cap player in the Other Agricultural Products sector, has seen its valuation parameters deteriorate significantly, shifting from an attractive to a risky profile. This change reflects mounting concerns over the company’s financial health and market positioning, as evidenced by its sharply negative price-to-earnings (P/E) ratio and subdued returns compared to sector peers and the broader market.
Read full news article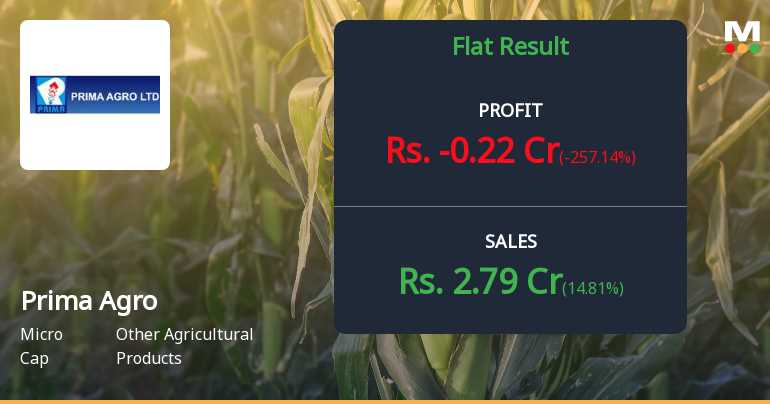
Prima Agro Q4 FY26: Operating Losses Deepen Amid Revenue Growth
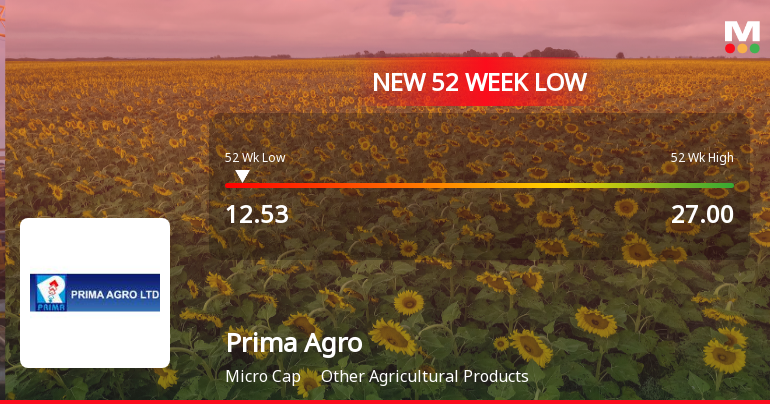
Prima Agro Ltd., a Cochin-based agricultural products company with a market capitalisation of ₹9.00 crores, reported a net loss of ₹0.22 crores in Q4 FY26, marking a sharp reversal from the ₹0.14 crores profit recorded in the previous quarter. The company's shares, currently trading at ₹16.91, have declined 26.48% over the past year, significantly underperforming the broader market and its sector peers.
Read full news article Announcements
Closure of Trading Window
25-Jun-2026 | Source : BSEIntimation regarding the Closure of Trading Window in terms of SEBI (Prohibition of Insider Trading) Regulations 2015 for the Quarter ending 30th June 2026.
Announcement under Regulation 30 (LODR)-Newspaper Publication
30-May-2026 | Source : BSEThe Company hereby submits the copy of Newspaper publication of Audited Financial Results for the Quarter and Financial year ended 31st March 2026.
Compliances-Reg.24(A)-Annual Secretarial Compliance
28-May-2026 | Source : BSEAnnual Secretarial Compliance Report for the Financial year 2025-26.
Corporate Actions

No Upcoming Board Meetings

No Dividend history available

No Splits history available

No Bonus history available

No Rights history available
Quality key factors
Valuation key factors
Technicals key factors
 Technical Indicator Scale: Bearish, Mildly Bearish, Sideways, Mildly Bullish, Bullish Turned
 Shareholding Snapshot : Mar 2026
Shareholding Compare (%holding)
Non Institution
None
Held by 0 Schemes
Held by 0 FIIs
Ayyappa Roller Flour 1203760001197434 (9.42%)
None
57.46%
Quarterly Results Snapshot (Consolidated) - Mar'26 - QoQ

QoQ Growth in quarter ended Mar 2026 is 14.81% vs -8.65% in Dec 2025

QoQ Growth in quarter ended Mar 2026 is -257.14% vs -57.58% in Dec 2025
Half Yearly Results Snapshot (Consolidated) - Sep'25
Growth in half year ended Sep 2025 is -0.57% vs -22.77% in Sep 2024
Growth in half year ended Sep 2025 is 101.82% vs -217.02% in Sep 2024
Nine Monthly Results Snapshot (Consolidated) - Dec'25
YoY Growth in nine months ended Dec 2025 is -0.39% vs -20.08% in Dec 2024
YoY Growth in nine months ended Dec 2025 is 112.03% vs -203.91% in Dec 2024
Annual Results Snapshot (Consolidated) - Mar'26
YoY Growth in year ended Mar 2026 is 3.56% vs -18.99% in Mar 2025
YoY Growth in year ended Mar 2026 is 86.67% vs -162.50% in Mar 2025
About Prima Agro Ltd

Company Coordinates


