
Compare Crescentis Capit with Similar Stocks
Stock DNA
Non Banking Financial Company (NBFC)
INR 203 Cr (Micro Cap)
NA (Loss Making)
9
0.00%
0.00
-4.04%
2.42
Total Returns (Price + Dividend) 
Latest dividend: 1.0000 per share ex-dividend date: Sep-07-2011
Risk Adjusted Returns v/s
Returns Beta

News
Crescentis Capital Ltd Downgraded to Strong Sell Amid Weak Financials and Mixed Technicals
Crescentis Capital Ltd, a micro-cap player in the Non Banking Financial Company (NBFC) sector, has seen its investment rating downgraded from Sell to Strong Sell as of 29 June 2026. This shift reflects deteriorating financial fundamentals, mixed technical indicators, and valuation concerns, despite the stock’s recent market-beating returns over the past year.
Read full news article
Crescentis Capital Ltd Upgraded to Sell on Improved Technicals Despite Weak Financials
Crescentis Capital Ltd, a micro-cap player in the Non Banking Financial Company (NBFC) sector, has seen its investment rating upgraded from Strong Sell to Sell as of 22 June 2026. This change reflects a nuanced assessment across four key parameters: quality, valuation, financial trend, and technicals. While the company continues to grapple with weak fundamentals and negative earnings, improved technical indicators have prompted a more favourable outlook from analysts.
Read full news article
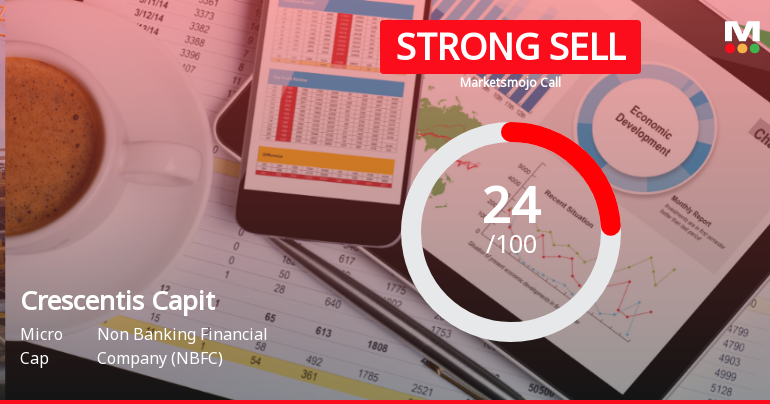
Crescentis Capital Ltd is Rated Strong Sell
Crescentis Capital Ltd is rated Strong Sell by MarketsMOJO, with this rating last updated on 29 May 2026. However, the analysis and financial metrics discussed here reflect the company’s current position as of 12 June 2026, providing investors with the most up-to-date view of the stock’s fundamentals, returns, and technical outlook.
Read full news article Announcements
Disclosure Under Regulation 29(2) Of The SEBI (Substantial Acquisition Of Shares And Takeovers) Regulations 2011 - Inter-Se Transfer Of Shares Within The Promoter Group By Way Of Gift
26-Jun-2026 | Source : BSEGift of shares between the promoters
Closure of Trading Window
26-Jun-2026 | Source : BSEThe trading window is being closed in connection with the consideration and declaration of the Unaudited Financial results of the Company for the Quarter ended 30th June 2026.
Unmodified Opinon
30-May-2026 | Source : BSEsubmission of Declaraion pursuant to Regulation 33(3)(d)
Corporate Actions

No Upcoming Board Meetings

Crescentis Capital Ltd has declared 10% dividend, ex-date: 07 Sep 11

No Splits history available

No Bonus history available

Crescentis Capital Ltd has announced 7:10 rights issue, ex-date: 06 Jun 25
Quality key factors
Valuation key factors
Technicals key factors
 Technical Indicator Scale: Bearish, Mildly Bearish, Sideways, Mildly Bullish, Bullish Turned
 Shareholding Snapshot : Mar 2026
Shareholding Compare (%holding)
Promoters
None
Held by 0 Schemes
Held by 0 FIIs
Dr. Bhaskara Rao Bollineni (68.8%)
Soptex Developements Limited (1.45%)
20.11%
Quarterly Results Snapshot (Standalone) - Mar'26 - QoQ

QoQ Growth in quarter ended Mar 2026 is -300.00% vs 1,330.77% in Dec 2025
QoQ Growth in quarter ended Mar 2026 is -717.65% vs 347.92% in Dec 2025
Half Yearly Results Snapshot (Standalone) - Sep'25

Growth in half year ended Sep 2025 is 4.83% vs -28.08% in Sep 2024
Growth in half year ended Sep 2025 is 8.71% vs -54.56% in Sep 2024
Nine Monthly Results Snapshot (Standalone) - Dec'25
YoY Growth in nine months ended Dec 2025 is 1,175.71% vs -93.86% in Dec 2024
YoY Growth in nine months ended Dec 2025 is 346.06% vs -117.61% in Dec 2024
Annual Results Snapshot (Standalone) - Mar'26
YoY Growth in year ended Mar 2026 is 149.01% vs -120.09% in Mar 2025
YoY Growth in year ended Mar 2026 is 53.32% vs -144.79% in Mar 2025
About Crescentis Capital Ltd

Company Coordinates


