
Compare RTCL with Similar Stocks
Dashboard
With a Operating Losses, the company has a Weak Long Term Fundamental Strength
- Poor long term growth as Operating profit has grown by an annual rate 13.82% of over the last 5 years
- Company's ability to service its debt is weak with a poor EBIT to Interest (avg) ratio of -0.04
Flat results in Mar 26
With ROE of 3.9, it has a Very Expensive valuation with a 0.4 Price to Book Value
Below par performance in long term as well as near term
Total Returns (Price + Dividend) 
RTCL for the last several years.
Risk Adjusted Returns v/s
Returns Beta

News
When is the next results date for RTCL Ltd?
The next results date for RTCL Ltd is scheduled for 11 August 2026....
Read full news articleAre RTCL Ltd latest results good or bad?
RTCL Ltd's latest financial results for Q4 FY26 highlight significant operational challenges. The company reported net sales of ₹0.00 crores, indicating a complete absence of revenue generation for three consecutive quarters. This revenue vacuum has led to an operating loss of ₹0.20 crores, marking the worst quarterly performance in recent history. In contrast, the company had previously reported an operating profit of ₹0.87 crores in Q1 FY26 when it generated revenue of ₹1.05 crores. The net profit for Q4 FY26 was ₹0.12 crores, primarily driven by other income of ₹0.52 crores, which has become the sole contributor to profitability amidst ongoing operational distress. The company's reliance on non-operating income raises concerns about the sustainability of its financial performance. Additionally, the return on equity stands at 4.55%, reflecting weak profitability relative to shareholder funds. The financ...
Read full news article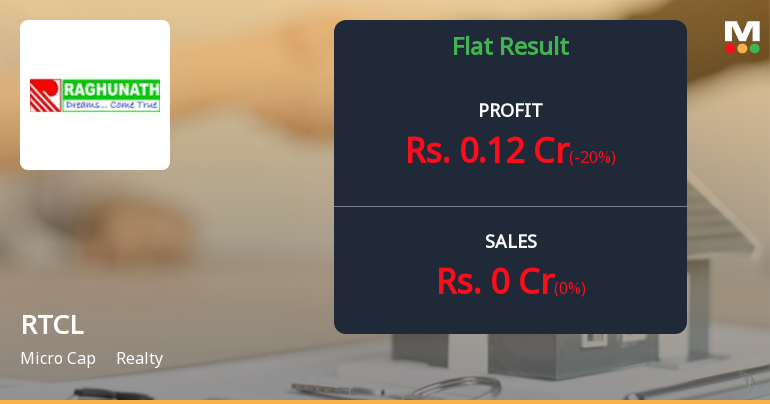
RTCL Ltd Q4 FY26: Revenue Drought Continues as Losses Mount
RTCL Limited, a micro-cap real estate development company with a market capitalisation of ₹16.92 crores, reported a consolidated net profit of ₹0.12 crores for Q4 FY26, marking a sharp 61.29% decline year-on-year and a 20.00% drop quarter-on-quarter. The company continues to grapple with zero revenue generation for the fourth consecutive quarter, relying entirely on other income to post nominal profits whilst operating losses deepen.
Read full news article Announcements
Board Meeting Intimation for Intimation Of Board Meeting
27-Jul-2026 | Source : BSERaghunath Tobacco Company Ltdhas informed BSE that the meeting of the Board of Directors of the Company is scheduled on 11/08/2026 inter alia to consider and approve Intimation of Board meeting Un-audited Standalone & Consolidated Financial Result for the Quarter ended on 30 June 2026 of RTCL Limited
Intimation of Repayment of Commercial Paper (CP)
13-Jul-2026 | Source : BSECompliances as per regulation 51(1) & (2) of SEBI (LODR) regulation 2015 for the quarter ended on June 30th 2026 of RTCL Limited
Investor Compliant
13-Jul-2026 | Source : BSEStatement of investor Compliant During the Quarter ended on 30th June 2026 of RTCL Limited
Corporate Actions

11 Aug 2026

No Dividend history available

No Splits history available

No Bonus history available

No Rights history available
Quality key factors
Valuation key factors
Technicals key factors
 Technical Indicator Scale: Bearish, Mildly Bearish, Sideways, Mildly Bullish, Bullish Turned
 Shareholding Snapshot : Jun 2026
Shareholding Compare (%holding)
Promoters
None
Held by 0 Schemes
Held by 0 FIIs
Raghunth Holding & Finlease Pvt. Ltd. (36.98%)
None
42.06%
Quarterly Results Snapshot (Consolidated) - Mar'26 - QoQ
QoQ Growth in quarter ended Mar 2026 is 0.00% vs 0.00% in Dec 2025

QoQ Growth in quarter ended Mar 2026 is -20.00% vs -71.70% in Dec 2025
Half Yearly Results Snapshot (Consolidated) - Sep'25
Growth in half year ended Sep 2025 is 0.00% vs 0.00% in Sep 2024
Growth in half year ended Sep 2025 is 252.38% vs 180.00% in Sep 2024
Nine Monthly Results Snapshot (Consolidated) - Dec'25
YoY Growth in nine months ended Dec 2025 is 0.00% vs 0.00% in Dec 2024

YoY Growth in nine months ended Dec 2025 is 146.97% vs 164.00% in Dec 2024
Annual Results Snapshot (Consolidated) - Mar'26
YoY Growth in year ended Mar 2026 is 0.00% vs -100.00% in Mar 2025
YoY Growth in year ended Mar 2026 is 81.44% vs -53.81% in Mar 2025
About RTCL Ltd

Company Coordinates


