
Compare Madhusudan Sec. with Similar Stocks
Stock DNA
Non Banking Financial Company (NBFC)
INR 36 Cr (Micro Cap)
12.00
22
0.00%
0.00
5.97%
0.44
Total Returns (Price + Dividend) 
Madhusudan Sec. for the last several years.
Risk Adjusted Returns v/s
Returns Beta

News
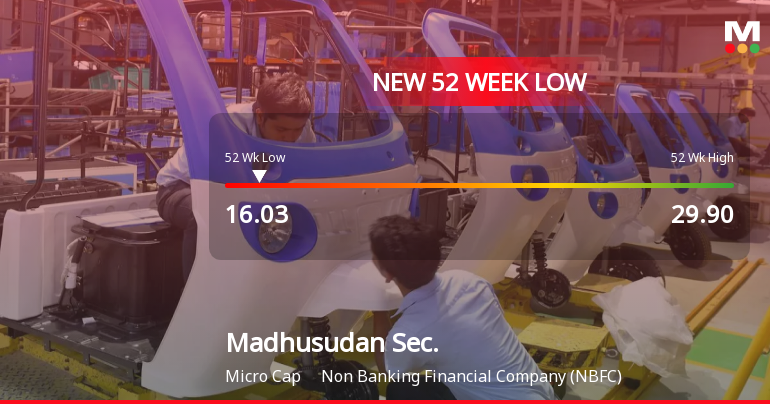
Madhusudan Securities Ltd Falls to 52-Week Low of Rs 16.03 as Sell-Off Deepens
For the second consecutive session, Madhusudan Securities Ltd closed lower, slipping to a fresh 52-week low of Rs 16.03 on 6 Jul 2026. This decline extends the stock’s year-long underperformance, with a 25.98% drop compared to the Sensex’s more modest 6.36% fall over the same period.
Read full news article
Madhusudan Securities Ltd is Rated Sell
Madhusudan Securities Ltd is rated Sell by MarketsMOJO, with this rating last updated on 29 May 2026. However, the analysis and financial metrics discussed here reflect the stock’s current position as of 02 July 2026, providing investors with an up-to-date view of the company’s fundamentals, valuation, financial trend, and technical outlook.
Read full news article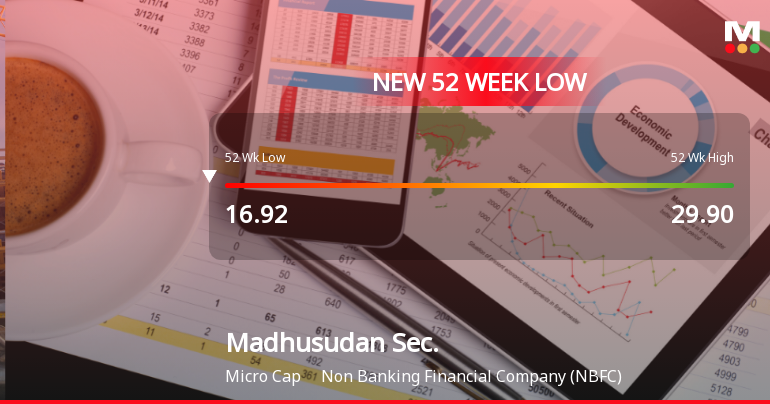
Announcements
Clarification Regarding Warning Letter Received For Delay In Compliance
29-Jun-2026 | Source : BSEWarning letter received from BSE Limited regarding the delay in filing application for the Name Change pursuant to ROC Approval.
Closure of Trading Window
25-Jun-2026 | Source : BSEClosure of Trading Window from July 01 2026 till 48 hours of declaration of Un-Audited Financial Results for the Quarter ending on June 30 2026
Announcement under Regulation 30 (LODR)-Resignation of Chief Financial Officer (CFO)
01-Jun-2026 | Source : BSEWe wish to inform you that Mr. Vishwanatha Srinivas has resigned from the position of CFO and KMP of the company with effect from 31st May 2026
Corporate Actions

No Upcoming Board Meetings

No Dividend history available

No Splits history available

No Bonus history available

No Rights history available
Quality key factors
Valuation key factors
Technicals key factors
 Technical Indicator Scale: Bearish, Mildly Bearish, Sideways, Mildly Bullish, Bullish Turned
 Shareholding Snapshot : Mar 2026
Shareholding Compare (%holding)
Non Institution
None
Held by 0 Schemes
Held by 2 FIIs (2.45%)
Salim Pyarli Govani (8.94%)
Cheralathan . (7.54%)
56.38%
Quarterly Results Snapshot (Consolidated) - Mar'26 - QoQ

QoQ Growth in quarter ended Mar 2026 is -58.37% vs 0.00% in Dec 2025
QoQ Growth in quarter ended Mar 2026 is -110.08% vs 1,568.00% in Dec 2025
Half Yearly Results Snapshot (Standalone) - Sep'25
Growth in half year ended Sep 2025 is 0.00% vs 0.00% in Sep 2024

Growth in half year ended Sep 2025 is 64.29% vs -281.82% in Sep 2024
Nine Monthly Results Snapshot (Standalone) - Dec'25
YoY Growth in nine months ended Dec 2025 is 0.00% vs 0.00% in Dec 2024
YoY Growth in nine months ended Dec 2025 is 1,013.33% vs -350.00% in Dec 2024
Annual Results Snapshot (Consolidated) - Mar'26
YoY Growth in year ended Mar 2026 is 10,314.29% vs -84.44% in Mar 2025
YoY Growth in year ended Mar 2026 is 438.55% vs -653.33% in Mar 2025
About Madhusudan Securities Ltd

Company Coordinates


