
Compare GHV Infra with Similar Stocks
Stock DNA
Computers - Software & Consulting
INR 1,536 Cr (Small Cap)
33.00
38
0.00%
1.48
34.21%
12.43
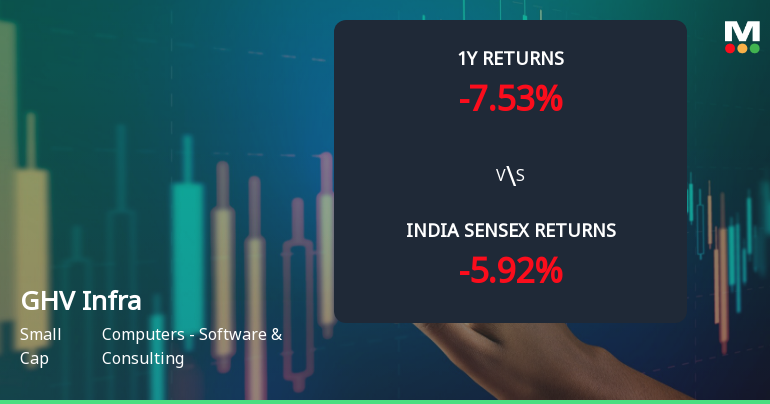
Total Returns (Price + Dividend) 
GHV Infra for the last several years.
Risk Adjusted Returns v/s
Returns Beta

News
GHV Infra Projects Ltd Sees Mixed Technical Signals Amid Price Momentum Shift
GHV Infra Projects Ltd has experienced a notable shift in its technical momentum, reflecting a complex interplay of bullish and bearish signals across multiple timeframes. Despite a recent 4.98% intraday gain to ₹212.95, the stock remains under pressure with a MarketsMOJO Mojo Grade downgrade from Hold to Sell, underscoring the challenges faced by this small-cap player in the Computers - Software & Consulting sector.
Read full news article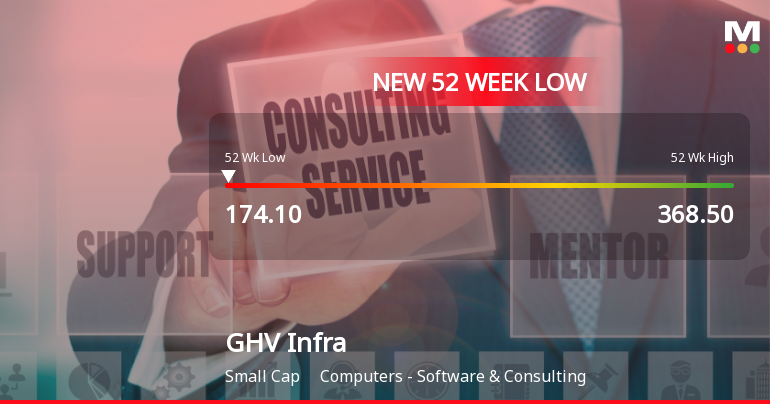
GHV Infra Projects Ltd Falls to 52-Week Low of Rs 174.1 as Sell-Off Deepens
For the tenth consecutive session, GHV Infra Projects Ltd has closed lower, culminating in a fresh 52-week low of Rs 174.1 on 8 Jul 2026. This marks a steep 20.79% decline over the past ten trading days, underscoring sustained selling pressure despite the broader market's mixed performance.
Read full news article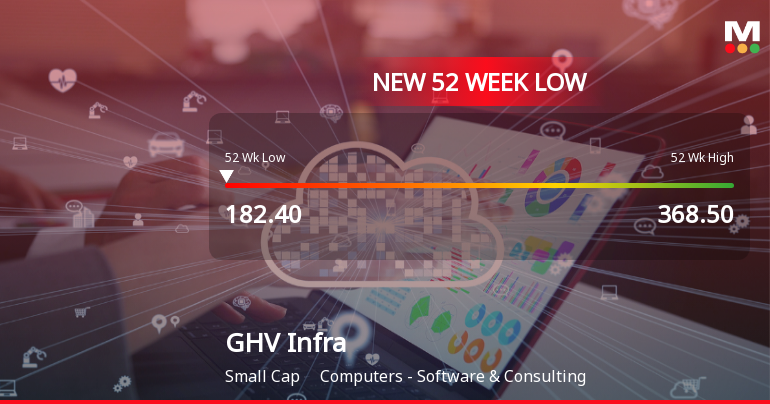
Five Consecutive Losses Push GHV Infra Projects Ltd to a New 52-Week Low
For the ninth consecutive session, GHV Infra Projects Ltd has closed lower, culminating in a fresh 52-week low of Rs 182.55 on 7 Jul 2026. This marks a 16.57% decline over this losing streak, significantly underperforming its sector and the broader market indices.
Read full news article Announcements
Compliances-Certificate under Reg. 74 (5) of SEBI (DP) Regulations 2018
06-Jul-2026 | Source : BSEThe Company has informed to the exchange about the Certificate received under 74(5) of SEBI (DP) Regulations 2018 for the Quarter ended June 30 2026 from MUFG Intime India Private Limited
Announcement under Regulation 30 (LODR)-Credit Rating
01-Jul-2026 | Source : BSEThe Company has informed the exchange about the Revision in Credit Rating as issued by Acuite Ratings & Research Limited
Closure of Trading Window
25-Jun-2026 | Source : BSEIntimation of Closure of Trading Window
Corporate Actions

No Upcoming Board Meetings

No Dividend history available

GHV Infra Projects Ltd has announced 5:10 stock split, ex-date: 16 Sep 25

GHV Infra Projects Ltd has announced 3:2 bonus issue, ex-date: 16 Sep 25

No Rights history available
Quality key factors
Valuation key factors
Technicals key factors
 Technical Indicator Scale: Bearish, Mildly Bearish, Sideways, Mildly Bullish, Bullish Turned
 Shareholding Snapshot : Mar 2026
Shareholding Compare (%holding)
Promoters
19.5157
Held by 0 Schemes
Held by 0 FIIs
Jhv Commercials Llp (58.78%)
Fortune Financial And Equities Services Private Limited (10%)
23.38%
Quarterly Results Snapshot (Standalone) - Mar'26 - YoY

YoY Growth in quarter ended Mar 2026 is 29.49% vs 0.00% in Mar 2025

YoY Growth in quarter ended Mar 2026 is 41.92% vs 17,575.00% in Mar 2025
Half Yearly Results Snapshot (Standalone) - Sep'25
Growth in half year ended Sep 2025 is 25,064.76% vs 0.00% in Sep 2024
Growth in half year ended Sep 2025 is 7,490.48% vs 163.64% in Sep 2024
Nine Monthly Results Snapshot (Standalone) - Dec'25
YoY Growth in nine months ended Dec 2025 is 1,908.92% vs 0.00% in Dec 2024
YoY Growth in nine months ended Dec 2025 is 607.26% vs 980.56% in Dec 2024
Annual Results Snapshot (Standalone) - Mar'26
YoY Growth in year ended Mar 2026 is 227.53% vs 0.00% in Mar 2025
YoY Growth in year ended Mar 2026 is 146.41% vs 4,088.37% in Mar 2025
About GHV Infra Projects Ltd


