
Compare Panama Petrochem with Similar Stocks
Total Returns (Price + Dividend) 
Latest dividend: 3 per share ex-dividend date: Sep-02-2025
Risk Adjusted Returns v/s
Returns Beta

News
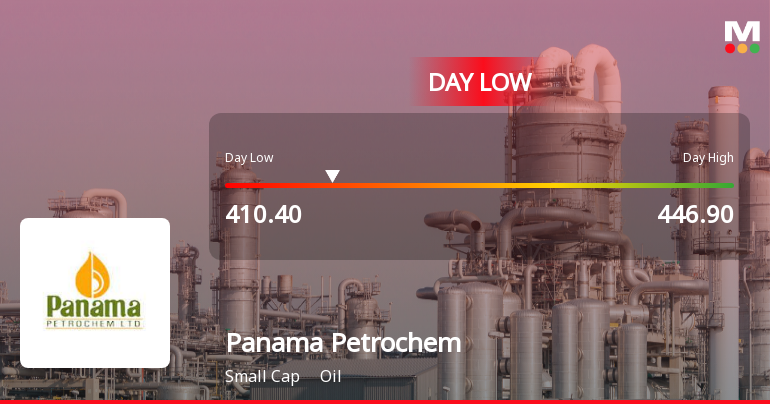
Panama Petrochem Ltd Hits Intraday Low Amid Price Pressure on 25 June 2026
Panama Petrochem Ltd experienced a significant intraday decline on 25 Jun 2026, touching a low of Rs 418.6, reflecting a 6.93% drop from previous levels. The stock underperformed its sector and broader market indices, continuing a three-day losing streak amid persistent price pressures.
Read full news article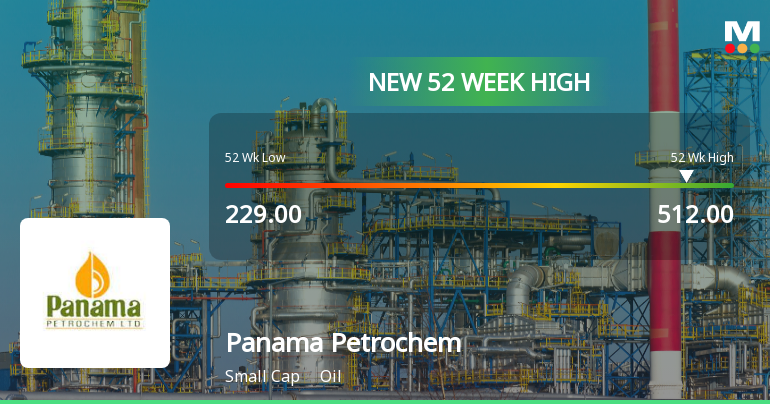
Broad-Based Technical Strength Lifts Panama Petrochem Ltd to 52-Week High of Rs 512
Surging to an all-time high of Rs 512 on 22 Jun 2026, Panama Petrochem Ltd has demonstrated robust price momentum, outpacing the broader market with a 30.7% gain over the past year against the Sensex’s decline of 6.4%. This milestone reflects a confluence of bullish technical indicators and sustained upward price trends.
Read full news article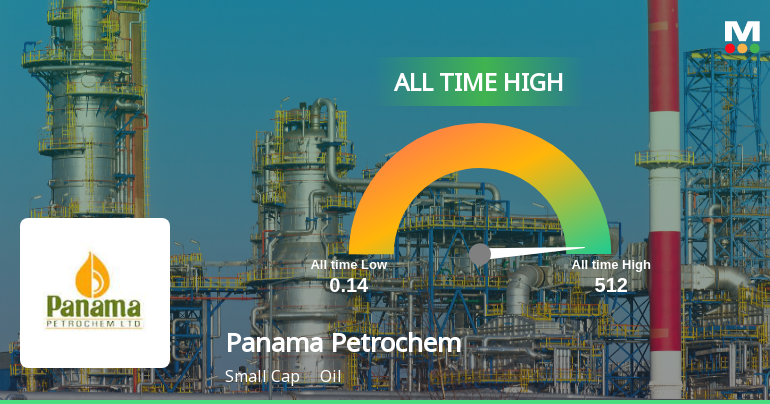
Panama Petrochem Ltd Hits All-Time High of Rs 512 as Momentum Builds Across Timeframes
Extending a remarkable rally that has spanned months, Panama Petrochem Ltd touched a fresh all-time high of Rs 512 on 22 Jun 2026, underscoring strong momentum across multiple timeframes despite a slight underperformance against its sector on the day.
Read full news article Announcements
Clarification To The E-Mail Received Regarding Price Movement
23-Jun-2026 | Source : BSEClarification to the email received regarding Price Movement.
Clarification sought from Panama Petrochem Ltd
22-Jun-2026 | Source : BSEThe Exchange has sought clarification from Panama Petrochem Ltd on June 22 2026 with reference to significant movement in price in order to ensure that investors have latest relevant information about the company and to inform the market so that the interest of the investors is safeguarded.
The reply is awaited.
Clarification To The E-Mail Received Regarding Increase In Volume.
19-Jun-2026 | Source : BSEClarification to the e-mail received regarding increase in volume.
Corporate Actions

No Upcoming Board Meetings

Panama Petrochem Ltd has declared 150% dividend, ex-date: 02 Sep 25

Panama Petrochem Ltd has announced 2:10 stock split, ex-date: 19 Sep 14

Panama Petrochem Ltd has announced 1:2 bonus issue, ex-date: 03 Oct 17

No Rights history available
Quality key factors
Valuation key factors
Technicals key factors
 Technical Indicator Scale: Bearish, Mildly Bearish, Sideways, Mildly Bullish, Bullish Turned
 Shareholding Snapshot : Mar 2026
Shareholding Compare (%holding)
Promoters
None
Held by 1 Schemes (0.0%)
Held by 45 FIIs (11.29%)
Amin Amirali Rayani (8.04%)
Connecor Investment Enterprise Ltd (3.72%)
16.34%
Quarterly Results Snapshot (Consolidated) - Mar'26 - QoQ

QoQ Growth in quarter ended Mar 2026 is 6.16% vs 0.24% in Dec 2025
QoQ Growth in quarter ended Mar 2026 is 55.16% vs -13.55% in Dec 2025
Half Yearly Results Snapshot (Consolidated) - Sep'25

Growth in half year ended Sep 2025 is 7.06% vs 24.07% in Sep 2024
Growth in half year ended Sep 2025 is 1.43% vs 1.56% in Sep 2024
Nine Monthly Results Snapshot (Consolidated) - Dec'25
YoY Growth in nine months ended Dec 2025 is 6.86% vs 29.82% in Dec 2024
YoY Growth in nine months ended Dec 2025 is -0.94% vs 6.40% in Dec 2024
Annual Results Snapshot (Consolidated) - Mar'26
YoY Growth in year ended Mar 2026 is 9.72% vs 18.51% in Mar 2025
YoY Growth in year ended Mar 2026 is 13.62% vs -4.16% in Mar 2025
About Panama Petrochem Ltd

Company Coordinates


