
Compare JOJO with Similar Stocks
Dashboard
Poor Management Efficiency with a low ROE of 5.11%
- The company has been able to generate a Return on Equity (avg) of 5.11% signifying low profitability per unit of shareholders funds
Company has a Debt to Equity ratio (avg) of 0.08 times
Healthy long term growth as Net Sales has grown by an annual rate of 90.18% and Operating profit at 57.23%
With a growth in Net Profit of 369.61%, the company declared Outstanding results in Mar 26
With ROE of 10.3, it has a Very Expensive valuation with a 13.7 Price to Book Value
Despite the size of the company, domestic mutual funds hold only 0% of the company
Stock DNA
Media & Entertainment
INR 769 Cr (Micro Cap)
132.00
23
0.00%
-0.09
10.34%
13.67
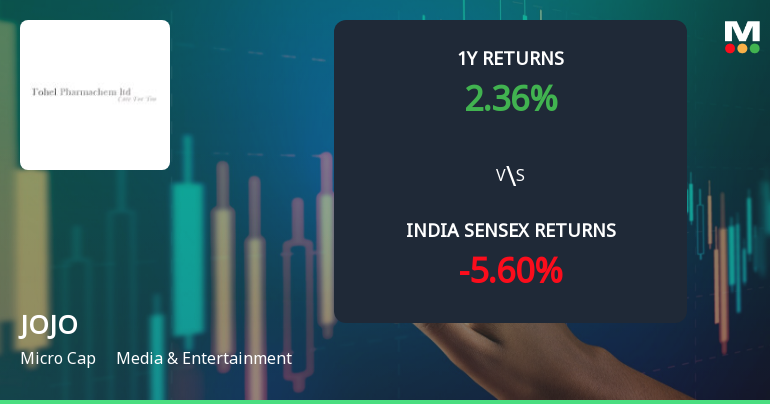
Total Returns (Price + Dividend) 
Latest dividend: 0 per share ex-dividend date: Sep-22-2025
Risk Adjusted Returns v/s
Returns Beta

News
JOJO Ltd Technical Momentum Shifts Amid Mixed Market Signals
JOJO Ltd, a micro-cap player in the Media & Entertainment sector, has experienced a notable shift in its technical momentum, moving from a mildly bullish stance to a sideways trend. Despite a recent downgrade from a Sell to a Hold rating by MarketsMOJO on 13 April 2026, the stock’s technical indicators present a complex picture, reflecting both bearish and bullish signals across different timeframes.
Read full news article
JOJO Ltd is Rated Hold by MarketsMOJO
JOJO Ltd is rated 'Hold' by MarketsMOJO, with this rating last updated on 16 May 2026. However, the analysis and financial metrics discussed here reflect the stock's current position as of 20 June 2026, providing investors with an up-to-date view of the company’s performance and outlook.
Read full news article
JOJO Ltd Technical Momentum Shifts Signal Mildly Bullish Outlook Amid Mixed Indicators
JOJO Ltd, a micro-cap player in the Media & Entertainment sector, has recently exhibited a subtle shift in its technical momentum, moving from a sideways trend to a mildly bullish stance. Despite mixed signals from key technical indicators such as MACD, RSI, and moving averages, the stock’s recent price action and upgraded mojo grade suggest cautious optimism for investors navigating a volatile market environment.
Read full news article Announcements
Integration Of JOJO App As A Bundled Offering On VZY Smart Tvs
16-Jun-2026 | Source : BSEIntegration of JOJO App as a Bundled Offering on VZY Smart TVs.
Board Meeting Outcome for Sub-Division Of The Face Value Of Each Equity Share Of The Company From Rs 10/- (Rupees Ten Only) Each To Rs 5/~ (Rupees Five Only) Each.
10-Jun-2026 | Source : BSESub-division of the face value of each Equity Share of the Company from Rs 10/- (Rupees Ten only) each to Rs 5/~ (Rupees Five only) each.
Revised Voting Results Along With Scrutinizers Report
08-Jun-2026 | Source : BSERevised voting results along with Scrutinizers Report
Corporate Actions

No Upcoming Board Meetings


No Splits history available

No Bonus history available

No Rights history available
Quality key factors
Valuation key factors
Technicals key factors
 Technical Indicator Scale: Bearish, Mildly Bearish, Sideways, Mildly Bullish, Bullish Turned
 Shareholding Snapshot : Mar 2026
Shareholding Compare (%holding)
Promoters
None
Held by 0 Schemes
Held by 0 FIIs
Dhruvin Daksheshbhai Shah (34.8%)
Jay Prakash Kariya (4.91%)
30.9%
Quarterly Results Snapshot (Consolidated) - Mar'26 - QoQ

QoQ Growth in quarter ended Mar 2026 is 54.60% vs 454.42% in Dec 2025

QoQ Growth in quarter ended Mar 2026 is 369.61% vs 229.03% in Dec 2025
Half Yearly Results Snapshot (Consolidated) - Sep'25
Growth in half year ended Sep 2025 is 379.41% vs 353.33% in Sep 2024
Growth in half year ended Sep 2025 is 92.62% vs -1,255.00% in Sep 2024
Nine Monthly Results Snapshot (Consolidated) - Dec'25
YoY Growth in nine months ended Dec 2025 is 285.47% vs 1,380.00% in Dec 2024
YoY Growth in nine months ended Dec 2025 is 147.67% vs -855.56% in Dec 2024
Annual Results Snapshot (Consolidated) - Mar'26
YoY Growth in year ended Mar 2026 is 446.92% vs -9.48% in Mar 2025
YoY Growth in year ended Mar 2026 is 438.55% vs -170.94% in Mar 2025
About JOJO Ltd

Company Coordinates


