
Compare Norben Tea with Similar Stocks
Dashboard
With a Operating Losses, the company has a Weak Long Term Fundamental Strength
- Low ability to service debt as the company has a high Debt to EBITDA ratio of 8.59 times
- The company has been able to generate a Return on Equity (avg) of 0.72% signifying low profitability per unit of shareholders funds
Flat results in Mar 26
With ROCE of 0.9, it has a Very Expensive valuation with a 4.3 Enterprise value to Capital Employed
Total Returns (Price + Dividend) 
Norben Tea for the last several years.
Risk Adjusted Returns v/s
Returns Beta

News
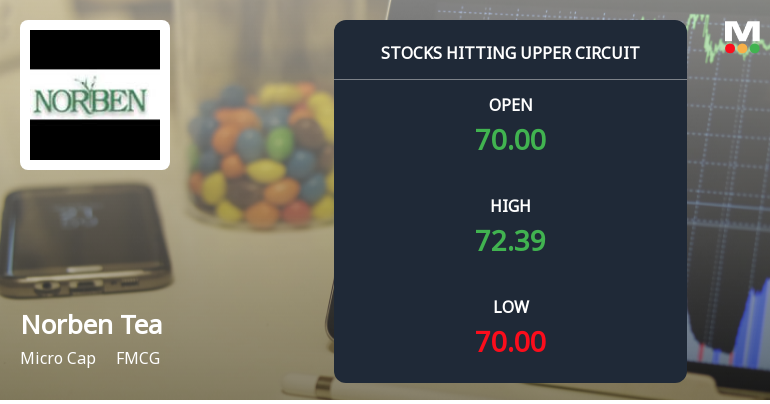
Norben Tea & Exports Ltd Locks at Upper Circuit With 5.0% Gain — Buyers Queue, Sellers Absent
At Rs 72.51, the buying was done — not because demand dried up, but because the exchange wouldn't let the stock go any higher. Norben Tea & Exports Ltd locked at its upper circuit of 5.0% on 24 Jun 2026, with buyers queuing and no sellers willing to part with shares.
Read full news article
Norben Tea & Exports Ltd Downgraded to Strong Sell Amid Technical and Fundamental Weaknesses
Norben Tea & Exports Ltd has seen its investment rating downgraded from Sell to Strong Sell as of 17 Jun 2026, reflecting deteriorating technical indicators and weak fundamental performance. The micro-cap FMCG company’s recent flat financial results, combined with a challenging debt profile and expensive valuation metrics, have prompted a reassessment of its outlook by market analysts.
Read full news article
Norben Tea & Exports Ltd is Rated Sell
Norben Tea & Exports Ltd is rated 'Sell' by MarketsMOJO, with this rating last updated on 08 June 2026. However, all fundamentals, returns, and financial metrics discussed here reflect the stock's current position as of 16 June 2026, providing investors with the latest insights into the company’s performance and outlook.
Read full news article Announcements
Announcement under Regulation 30 (LODR)-Newspaper Publication
25-Jun-2026 | Source : BSENewspaper Publication - Notice of Special Window for Transfer and Dematerialisation of Physical Securities.
Cut Off Date For E-Voting
11-Jun-2026 | Source : BSEAGM E-voting Cut off Date
Announcement Under Regulation 30 (LODR)- Newspaper Publication.
11-Jun-2026 | Source : BSENewspaper Publication for evoting information for 36th Annual General Meeting of the Company.
Corporate Actions

No Upcoming Board Meetings

No Dividend history available

No Splits history available

No Bonus history available

No Rights history available
Quality key factors
Valuation key factors
Technicals key factors
 Technical Indicator Scale: Bearish, Mildly Bearish, Sideways, Mildly Bullish, Bullish Turned
 Shareholding Snapshot : Mar 2026
Shareholding Compare (%holding)
Non Institution
None
Held by 3 Schemes (0.09%)
Held by 0 FIIs
Tongani Tea Company Ltd (14.54%)
Kailash Dhanuka Huf (4.99%)
49.76%
Quarterly Results Snapshot (Standalone) - Mar'26 - QoQ

QoQ Growth in quarter ended Mar 2026 is -52.65% vs 26.36% in Dec 2025
QoQ Growth in quarter ended Mar 2026 is -977.78% vs -18.18% in Dec 2025
Half Yearly Results Snapshot (Standalone) - Sep'25
Growth in half year ended Sep 2025 is -20.44% vs 14.04% in Sep 2024
Growth in half year ended Sep 2025 is -60.00% vs 25.00% in Sep 2024
Nine Monthly Results Snapshot (Standalone) - Dec'25
YoY Growth in nine months ended Dec 2025 is 1.07% vs 21.89% in Dec 2024
YoY Growth in nine months ended Dec 2025 is -42.35% vs 226.87% in Dec 2024
Annual Results Snapshot (Standalone) - Mar'26
YoY Growth in year ended Mar 2026 is 5.49% vs 16.26% in Mar 2025
YoY Growth in year ended Mar 2026 is -61.11% vs 89.41% in Mar 2025
About Norben Tea & Exports Ltd

Company Coordinates


