
Compare IZMO with Similar Stocks
Dashboard
Poor Management Efficiency with a low ROE of 9.60%
- The company has been able to generate a Return on Equity (avg) of 9.60% signifying low profitability per unit of shareholders funds
The company is Net-Debt Free
Healthy long term growth as Operating profit has grown by an annual rate 49.02%
The company declared positive results in Mar'26 after flat results in Dec'25
With ROE of 11.6, it has a Very Expensive valuation with a 3.6 Price to Book Value
Despite the size of the company, domestic mutual funds hold only 0% of the company
Stock DNA
Computers - Software & Consulting
INR 1,480 Cr (Micro Cap)
31.00
20
0.00%
-0.01
11.63%
3.69
Total Returns (Price + Dividend) 
Latest dividend: 1.3 per share ex-dividend date: Sep-24-2009
Risk Adjusted Returns v/s
Returns Beta

News

IZMO Ltd Locks at Lower Circuit With 5% Loss — Sellers Queue, No Buyers in Sight
At Rs 964.95, sellers were still queuing — but there were no buyers willing to take the other side. IZMO Ltd locked at its lower circuit of 5% on 29 Jun 2026, with unfilled sell orders and a frozen price, signalling a pronounced imbalance in supply and demand.
Read full news article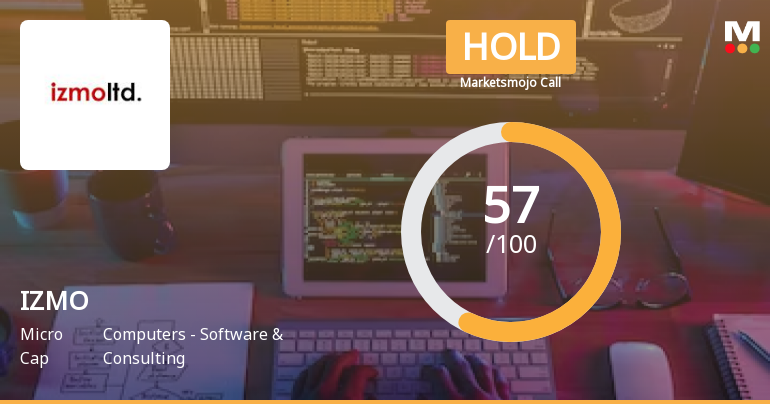
IZMO Ltd is Rated Hold
IZMO Ltd is rated 'Hold' by MarketsMOJO, with this rating last updated on 03 June 2026. However, the analysis and financial metrics discussed here reflect the stock's current position as of 26 June 2026, providing investors with the latest insights into the company’s performance and outlook.
Read full news article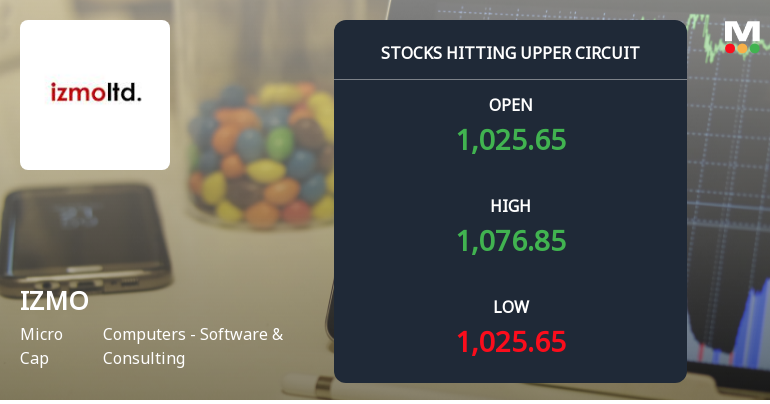
IZMO Ltd Locks at Upper Circuit With 5% Gain — Buyers Queue, Sellers Absent
At Rs 1,068, the buying was done — not because demand dried up, but because the exchange wouldn't let the stock go any higher. IZMO Ltd locked at its upper circuit of 5% on 19 Jun 2026, with buyers queuing and no sellers willing to part with shares.
Read full news article Announcements
Announcement under Regulation 30 (LODR)-Analyst / Investor Meet - Intimation
18-Jun-2026 | Source : BSEIntimation of Schedule of Analysts/Institutional Investors Meeting under Regulation 30 of the SEBI (Listing Obligations and Disclosure Requirements) Regulations 2015
Izmo Corporate Presentation
10-Jun-2026 | Source : BSEWe are enclosing izmo Corporate Presentation
Announcement under Regulation 30 (LODR)-Earnings Call Transcript
08-Jun-2026 | Source : BSEEarnings call Transcript
Corporate Actions

No Upcoming Board Meetings

IZMO Ltd has declared 13% dividend, ex-date: 24 Sep 09

No Splits history available

No Bonus history available

No Rights history available
Quality key factors
Valuation key factors
Technicals key factors
 Technical Indicator Scale: Bearish, Mildly Bearish, Sideways, Mildly Bullish, Bullish Turned
 Shareholding Snapshot : Mar 2026
Shareholding Compare (%holding)
Non Institution
None
Held by 0 Schemes
Held by 4 FIIs (3.27%)
Kiran Soni (16.1%)
Passage To India Master Fund Limited (3.24%)
51.89%
Quarterly Results Snapshot (Consolidated) - Mar'26 - QoQ

QoQ Growth in quarter ended Mar 2026 is 84.67% vs -1.66% in Dec 2025
QoQ Growth in quarter ended Mar 2026 is 47.86% vs -6.85% in Dec 2025
Half Yearly Results Snapshot (Consolidated) - Sep'25

Growth in half year ended Sep 2025 is 9.88% vs 23.05% in Sep 2024
Growth in half year ended Sep 2025 is -48.34% vs 254.69% in Sep 2024
Nine Monthly Results Snapshot (Consolidated) - Dec'25
YoY Growth in nine months ended Dec 2025 is 6.63% vs 20.77% in Dec 2024
YoY Growth in nine months ended Dec 2025 is -27.94% vs 146.85% in Dec 2024
Annual Results Snapshot (Consolidated) - Mar'26
YoY Growth in year ended Mar 2026 is 26.83% vs 20.27% in Mar 2025
YoY Growth in year ended Mar 2026 is -2.70% vs 87.64% in Mar 2025
About IZMO Ltd

Company Coordinates


