
Compare Purshottam Inves with Similar Stocks
Dashboard
With a Operating Losses, the company has a Weak Long Term Fundamental Strength
- Poor long term growth as Operating profit has grown by an annual rate of -189.99%
- PAT(Q) At Rs -3.49 cr has Fallen at -1889.7% (vs previous 4Q average)
- PBDIT(Q) Lowest at Rs -4.72 cr.
- PBT LESS OI(Q) Lowest at Rs -5.37 cr.
Risky - Negative Operating Profits
Underperformed the market in the last 1 year
Stock DNA
Non Banking Financial Company (NBFC)
INR 27 Cr (Micro Cap)
NA (Loss Making)
9
0.00%
0.37
-3.26%
0.48
Total Returns (Price + Dividend) 
Purshottam Inves for the last several years.
Risk Adjusted Returns v/s
Returns Beta

News
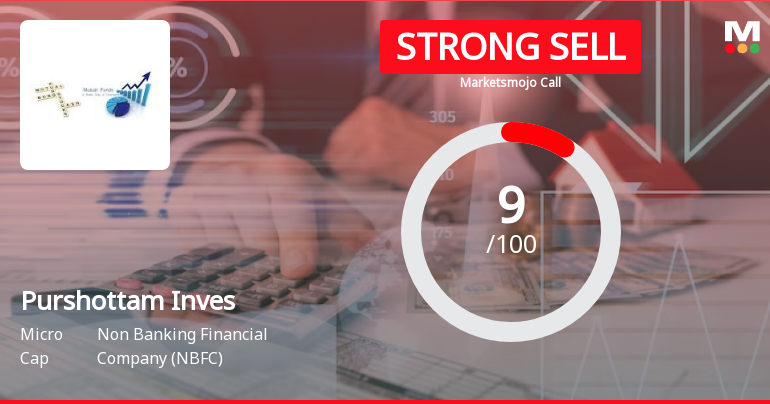
Purshottam Investofin Ltd is Rated Strong Sell
Purshottam Investofin Ltd is rated Strong Sell by MarketsMOJO. This rating was last updated on 13 April 2026. However, the analysis and financial metrics discussed here reflect the stock’s current position as of 10 July 2026, providing investors with the latest insights into the company’s performance and outlook.
Read full news article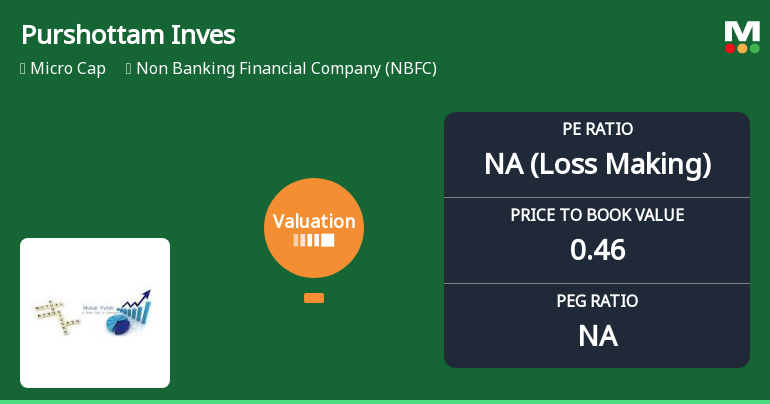
Purshottam Investofin Ltd Valuation Shifts Signal Elevated Risk Amid Market Volatility
Purshottam Investofin Ltd, a micro-cap player in the Non Banking Financial Company (NBFC) sector, has seen a marked deterioration in its valuation parameters, prompting a downgrade to a Strong Sell rating. The company’s price-to-earnings (P/E) ratio and other key multiples have shifted into risky territory, reflecting growing investor concerns amid challenging sector conditions and weak financial performance.
Read full news articleAre Purshottam Investofin Ltd latest results good or bad?
Purshottam Investofin Ltd's latest financial results present a complex picture. In Q3 FY26, the company achieved a net profit of ₹2.41 crores, marking the highest quarterly profit in its history, alongside an operating profit (PBDIT) of ₹3.75 crores, which also represents a quarterly high. These figures indicate a notable improvement in operational efficiency for the quarter. However, this positive quarterly performance is set against a backdrop of significant challenges. The company reported a dramatic 71.23% year-on-year decline in revenue over the first nine months of FY26, raising concerns about the sustainability of its business model. Such a sharp contraction in revenue typically suggests potential issues such as asset liquidation or a fundamental shift in operations that warrant careful examination. The average return on equity (ROE) for the company stands at 8.48%, which is below the industry stan...
Read full news article Announcements
Compliances-Certificate under Reg. 74 (5) of SEBI (DP) Regulations 2018
04-Jul-2026 | Source : BSEAs Attached
Disclosures under Reg. 29(1) of SEBI (SAST) Regulations 2011
25-Jun-2026 | Source : BSEThe Exchange has received the disclosure under Regulation 29(1) of SEBI (Substantial Acquisition of Shares & Takeovers) Regulations 2011 for Pure Spiritss Ltd
Closure of Trading Window
22-Jun-2026 | Source : BSEAs attached
Corporate Actions

No Upcoming Board Meetings

No Dividend history available

No Splits history available

No Bonus history available

No Rights history available
Quality key factors
Valuation key factors
Technicals key factors
 Technical Indicator Scale: Bearish, Mildly Bearish, Sideways, Mildly Bullish, Bullish Turned
 Shareholding Snapshot : Mar 2026
Shareholding Compare (%holding)
Non Institution
None
Held by 0 Schemes
Held by 4 FIIs (4.41%)
Mamta Aggarwal (0.0%)
Hallow Securities Private Limited (13.54%)
28.27%
Quarterly Results Snapshot (Standalone) - Mar'26 - QoQ

QoQ Growth in quarter ended Mar 2026 is -73.48% vs 123.37% in Dec 2025
QoQ Growth in quarter ended Mar 2026 is -244.81% vs 218.14% in Dec 2025
Half Yearly Results Snapshot (Standalone) - Sep'25
Growth in half year ended Sep 2025 is -12.05% vs 16.67% in Sep 2024
Growth in half year ended Sep 2025 is -165.45% vs -56.00% in Sep 2024
Nine Monthly Results Snapshot (Standalone) - Dec'25

YoY Growth in nine months ended Dec 2025 is 26.97% vs 17.19% in Dec 2024
YoY Growth in nine months ended Dec 2025 is 212.96% vs -92.52% in Dec 2024
Annual Results Snapshot (Standalone) - Mar'26
YoY Growth in year ended Mar 2026 is -16.08% vs 5.96% in Mar 2025
YoY Growth in year ended Mar 2026 is -383.78% vs -104.42% in Mar 2025
About Purshottam Investofin Ltd

Company Coordinates


