
Compare Jattashankar Ind with Similar Stocks
Dashboard
Weak Long Term Fundamental Strength with an average Return on Equity (ROE) of 3.59%
- Poor long term growth as Operating profit has grown by an annual rate 6.50% of over the last 5 years
- Company's ability to service its debt is weak with a poor EBIT to Interest (avg) ratio of -0.01
With ROE of 5.5, it has a Very Expensive valuation with a 9.5 Price to Book Value
Stock DNA
Garments & Apparels
INR 180 Cr (Micro Cap)
174.00
25
0.00%
0.00
5.49%
9.53
Total Returns (Price + Dividend) 
Jattashankar Ind for the last several years.
Risk Adjusted Returns v/s
Returns Beta

News

Jattashankar Industries Ltd is Rated Sell
Jattashankar Industries Ltd is rated 'Sell' by MarketsMOJO, with this rating last updated on 27 January 2026. However, the analysis and financial metrics discussed here reflect the stock's current position as of 24 June 2026, providing investors with an up-to-date view of the company’s fundamentals, valuation, financial trends, and technical outlook.
Read full news article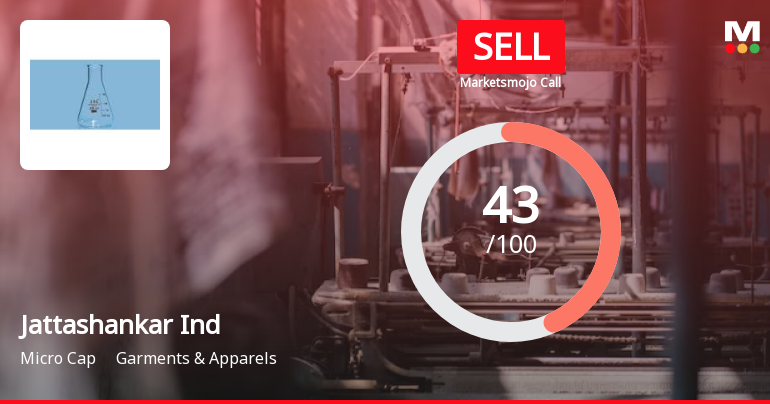
Jattashankar Industries Ltd is Rated Sell
Jattashankar Industries Ltd is rated 'Sell' by MarketsMOJO, with this rating last updated on 27 January 2026. However, the analysis and financial metrics discussed here reflect the stock's current position as of 12 June 2026, providing investors with an up-to-date perspective on the company’s fundamentals, valuation, financial trends, and technical outlook.
Read full news article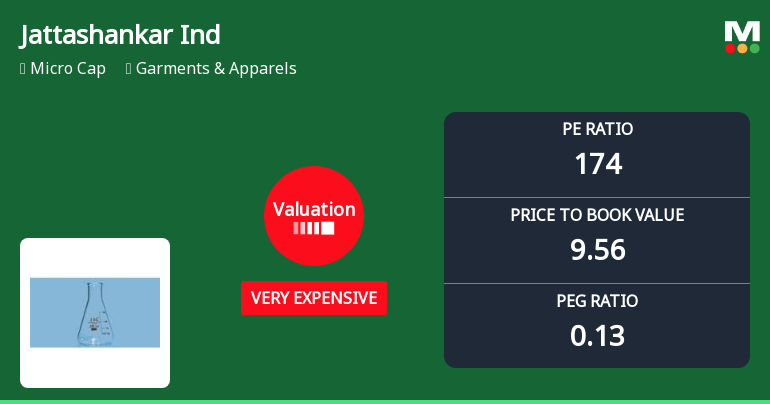
Jattashankar Industries Ltd Valuation Surges to Very Expensive Levels Amidst Strong Long-Term Returns
Jattashankar Industries Ltd, a micro-cap player in the Garments & Apparels sector, has seen a marked shift in its valuation parameters, moving from a risky to a very expensive grade. Despite delivering stellar returns over the medium to long term, the company’s current price-to-earnings (P/E) and price-to-book value (P/BV) ratios suggest investors should exercise caution amid stretched valuations.
Read full news article Announcements
Board Meeting Outcome for Outcome Of Board Meeting Held Today I.E. Saturday 20Th June 2026
20-Jun-2026 | Source : BSEwe hereby inform you that the meeting of the Board of Directors of the Company was held today i.e. Saturday 20th June 2026 at the Corporate Office of the Company has considered and approved the allotment of Warrants and receipt of 2nd tranche of consideration of the warrants.
Intimation Of Receipt Of In-Principle Approval For Issue Of 8155000 Warrants Convertible Into Equity Shares Of Jattashankar Industries Limited Under Regulation 30 Of The SEBI (Listing Obligations And Disclosure Requirements) Regulations 2015
17-Jun-2026 | Source : BSEIntimation of receipt of In-principle approval received for issue of 8155000 Convertible Warrants through Preferential Issue.
Submission Of Voting Results Of Resolution Passed Through Postal Ballot Pursuant To Regulation 44(3) Of SEBI (LODR) Regulations 2015
13-Jun-2026 | Source : BSESubmission of Voting Results - Postal Ballot
Corporate Actions

No Upcoming Board Meetings

No Dividend history available

No Splits history available

No Bonus history available

No Rights history available
Quality key factors
Valuation key factors
Technicals key factors
 Technical Indicator Scale: Bearish, Mildly Bearish, Sideways, Mildly Bullish, Bullish Turned
 Shareholding Snapshot : Mar 2026
Shareholding Compare (%holding)
Promoters
None
Held by 0 Schemes
Held by 0 FIIs
Nileshbhai Bhagvanji Bapodara (16.46%)
Laxmikant Singrodia (7.36%)
25.22%
Quarterly Results Snapshot (Standalone) - Mar'26 - YoY

YoY Growth in quarter ended Mar 2026 is 0.00% vs -100.00% in Mar 2025
YoY Growth in quarter ended Mar 2026 is 283.87% vs -109.42% in Mar 2025
Half Yearly Results Snapshot (Standalone) - Sep'25

Growth in half year ended Sep 2025 is -99.02% vs -8.63% in Sep 2024
Growth in half year ended Sep 2025 is 129.79% vs -238.24% in Sep 2024
Nine Monthly Results Snapshot (Standalone) - Dec'25
YoY Growth in nine months ended Dec 2025 is 585.68% vs -33.95% in Dec 2024
YoY Growth in nine months ended Dec 2025 is 151.14% vs -266.04% in Dec 2024
Annual Results Snapshot (Standalone) - Mar'26
YoY Growth in year ended Mar 2026 is 1,483.97% vs -49.91% in Mar 2025
YoY Growth in year ended Mar 2026 is 186.55% vs -131.15% in Mar 2025
About Jattashankar Industries Ltd

Company Coordinates


