
Compare Prakash Industri with Similar Stocks
Dashboard
Poor Management Efficiency with a low ROE of 8.79%
- The company has been able to generate a Return on Equity (avg) of 8.79% signifying low profitability per unit of shareholders funds
Poor long term growth as Net Sales has grown by an annual rate of 1.58% and Operating profit at 16.52% over the last 5 years
Flat results in Mar 26
Despite the size of the company, domestic mutual funds hold only 0.01% of the company
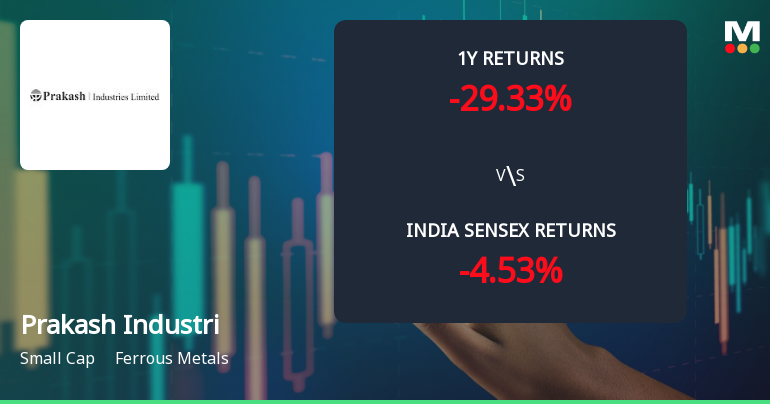
Underperformed the market in the last 1 year
Stock DNA
Ferrous Metals
INR 2,247 Cr (Small Cap)
7.00
24
1.18%
0.09
9.28%
0.63
Total Returns (Price + Dividend) 
Latest dividend: 1.5 per share ex-dividend date: Sep-17-2025
Risk Adjusted Returns v/s
Returns Beta

News
Prakash Industries Ltd Technical Momentum Shifts Amid Bearish Signals
Prakash Industries Ltd, a small-cap player in the ferrous metals sector, has experienced a notable shift in its technical momentum, prompting a downgrade from Hold to Sell by MarketsMOJO on 6 July 2026. Despite a modest 2.18% gain over the past week, the stock’s broader technical indicators signal a bearish outlook, reflecting challenges in sustaining upward price momentum amid sectoral headwinds.
Read full news article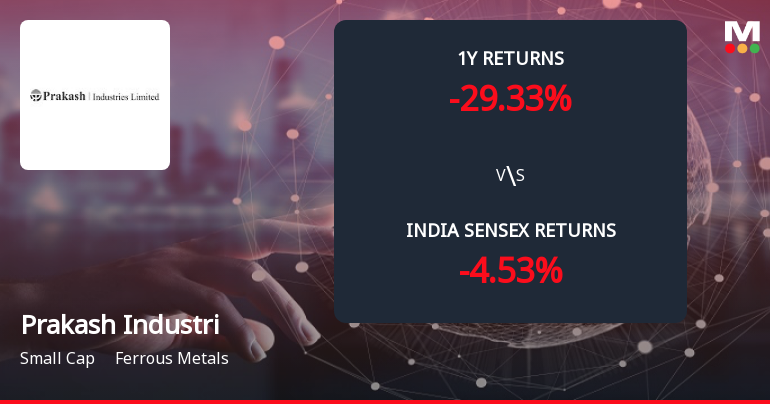
Prakash Industries Ltd Forms Death Cross, Signalling Potential Bearish Trend
Prakash Industries Ltd, a small-cap player in the ferrous metals sector, has recently formed a Death Cross, a significant technical indicator where the 50-day moving average crosses below the 200-day moving average. This development signals a potential shift towards a bearish trend, reflecting deteriorating momentum and raising concerns about the stock’s medium to long-term outlook.
Read full news article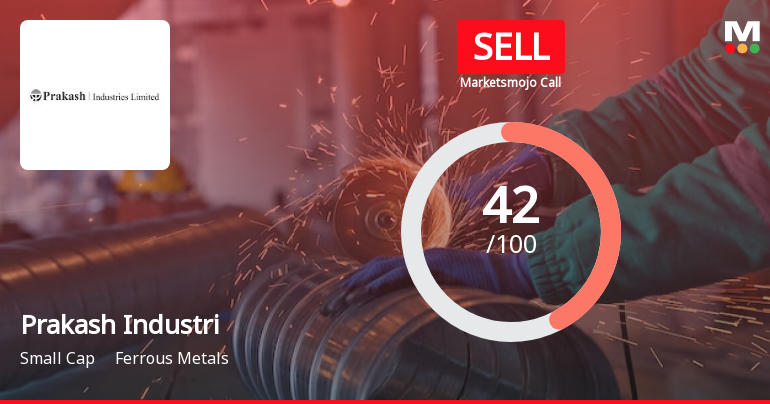
Prakash Industries Ltd is Rated Sell
Prakash Industries Ltd is rated 'Sell' by MarketsMOJO, with this rating last updated on 06 Jul 2026. However, the analysis and financial metrics discussed here reflect the stock's current position as of 29 July 2026, providing investors with an up-to-date view of the company’s fundamentals, returns, and market performance.
Read full news article Announcements
Compliances-Certificate under Reg. 74 (5) of SEBI (DP) Regulations 2018
15-Jul-2026 | Source : BSECompliances Certificate under Reg. 74(5) of SEBI (DP) Regulations 2018
Disclosures under Reg. 31(1) and 31(2) of SEBI (SAST) Regulations 2011.
04-Jul-2026 | Source : BSEThe Exchange has received Disclosure under Regulation 31(1) and 31(2) of SEBI (Substantial Acquisition of Shares & Takeovers) Regulations 2011 on July 04 2026 for Shree Labh Lakshmi Capital Services Pvt Ltd Vikram Agarwal & Ved Prakash Agarwal
Closure of Trading Window
27-Jun-2026 | Source : BSEClosure of Trading Window
Corporate Actions

No Upcoming Board Meetings

Prakash Industries Ltd has declared 15% dividend, ex-date: 17 Sep 25

No Splits history available

No Bonus history available

No Rights history available
Quality key factors
Valuation key factors
Technicals key factors
 Technical Indicator Scale: Bearish, Mildly Bearish, Sideways, Mildly Bullish, Bullish Turned
 Shareholding Snapshot : Jun 2026
Shareholding Compare (%holding)
Non Institution
8.6471
Held by 6 Schemes (0.01%)
Held by 54 FIIs (3.71%)
Ved Prakash Agarwal (12.49%)
Dolly Khanna (2.12%)
34.5%
Quarterly Results Snapshot (Standalone) - Mar'26 - QoQ

QoQ Growth in quarter ended Mar 2026 is 15.19% vs 10.43% in Dec 2025

QoQ Growth in quarter ended Mar 2026 is 7.45% vs 41.06% in Dec 2025
Half Yearly Results Snapshot (Standalone) - Sep'25
Growth in half year ended Sep 2025 is -21.55% vs 17.95% in Sep 2024
Growth in half year ended Sep 2025 is -15.43% vs 1.14% in Sep 2024
Nine Monthly Results Snapshot (Standalone) - Dec'25
YoY Growth in nine months ended Dec 2025 is -19.27% vs 13.72% in Dec 2024
YoY Growth in nine months ended Dec 2025 is -9.37% vs 2.01% in Dec 2024
Annual Results Snapshot (Standalone) - Mar'26
YoY Growth in year ended Mar 2026 is -13.34% vs 9.15% in Mar 2025
YoY Growth in year ended Mar 2026 is -6.28% vs 2.09% in Mar 2025
About Prakash Industries Ltd

Company Coordinates


