Vaibhav Global

  • Market Cap: Small Cap
  • Industry: Gems, Jewellery And Watches
  • ISIN: INE884A01027
  • NSEID: VAIBHAVGBL
  • BSEID: 532156
INR
244.00
-7.3 (-2.9%)
BSENSE

Jun 19, 03:30 PM

BSE+NSE Vol: 3.33 lacs

  • Price Points
  • Score
  • Mojo Parameters
  • Total Return
  • News and Corporate Actions
  • Key factors
  • Shareholding
  • Financials
  • CompanyCV
stock-summaryPrice Point
High/Low

1Day

52 Week

Valuation
Technical
Day's Volume

CASH

3.33 lacs (-36.09%) Volume

Shareholding (Mar 2026)

FII

16.44%

Held by 82 FIIs

DII

2.23%

Held by 3 DIIs

Promoter

57.43%

Why is Vaibhav Global Ltd falling/rising?

20-Jun-2026

As of 20-Jun, Vaibhav Global Ltd's stock price is Rs 244.00, down 2.9% after a trend reversal. Despite this decline, the company shows strong financials and positive long-term performance, suggesting potential for recovery.

As of 20-Jun, Vaibhav Global Ltd's stock price is currently at Rs 244.00, reflecting a decrease of Rs 7.3 or 2.9%. This decline follows a trend reversal after five consecutive days of gains, indicating that the stock has experienced a pullback. Today's performance shows that it has underperformed its sector by 3.55%, which may contribute to the downward movement in price.<BR><BR>Despite the recent drop, the stock has shown positive performance over longer periods, with a 5.99% increase over the past week and a 9.10% rise over the past month. However, the year-to-date performance is relatively modest at 4.45%, especially when compared to the Sensex, which has declined by 9.88% during the same timeframe.<BR><BR>The stock's trading performance is noteworthy as it remains above its 5-day, 20-day, 50-day, 100-day, and 200-day moving averages, suggesting a generally positive trend prior to the recent decline. Additionally, there has been a significant increase in investor participation, with a delivery volume rise of 38.06% against the 5-day average, indicating continued interest in the stock despite the current price drop.<BR><BR>Financially, the company is in a strong position, being net-debt free and reporting impressive growth in profits, with a 166.9% increase in PAT for the most recent quarter. This strong financial performance, coupled with a low PEG ratio of 0.2, suggests that the stock is undervalued compared to its peers, which could support a recovery in price in the future.<BR><BR>In summary, while Vaibhav Global Ltd is currently experiencing a decline in stock price, this is influenced by a recent trend reversal and underperformance relative to its sector. However, the company's strong financial fundamentals and positive longer-term performance metrics may provide a basis for potential recovery.

View full answer

How big is Vaibhav Global?

11-Jun-2026

As of 10th June, Vaibhav Global Ltd has a market capitalization of 3,810.00 Cr, with net sales of 3,691.80 Cr and a net profit of 266.12 Cr reported in the latest four quarters.

As of 10th June, Vaibhav Global Ltd has a market capitalization of 3,810.00 Cr, categorizing it as a Small Cap company.<BR><BR>In the latest four quarters, Vaibhav Global reported net sales of 3,691.80 Cr and a net profit of 266.12 Cr.<BR><BR>The latest annual period for the balance sheet is March 2025, with shareholder's funds amounting to 1,349.96 Cr and total assets of 1,992.49 Cr.

View full answer

Who are in the management team of Vaibhav Global?

11-Jun-2026

The management team of Vaibhav Global includes Sunil Agrawal (Managing Director), Sheela Agrawal, Pulak Prasad, Sanjeev Agrawal (Directors), Harsh Bahadur (Chairman), and several independent directors including James Patrick Clarke, Sunil Goyal, and Stephanie Renee Spong, along with Sushil Sharma as Company Secretary.

The management team of Vaibhav Global includes the following members:<BR><BR>1. **Sunil Agrawal** - Managing Director<BR>2. **Sheela Agrawal** - Director<BR>3. **Pulak Prasad** - Director<BR>4. **Harsh Bahadur** - Chairman (Non-Executive)<BR>5. **James Patrick Clarke** - Independent Director<BR>6. **Sunil Goyal** - Independent Director<BR>7. **Sanjeev Agrawal** - Director<BR>8. **Stephanie Renee Spong** - Independent Director<BR>9. **Sushil Sharma** - Company Secretary & Compliance Officer<BR><BR>If you need more specific information about any of these individuals or their roles, feel free to ask!

View full answer

Who are the peers of the Vaibhav Global?

11-Jun-2026

Vaibhav Global's peers include P N Gadgil Jewellers, Ethos, Senco Gold, Goldiam International, Timex Group, KDDL Ltd, Rajesh Exports, D.P. Abhushan, Shringar House, and Shanti Gold. In terms of performance, Timex Group leads with a 1-year return of 68.71%, while Vaibhav Global has a return of -13.24%.

Peers: The peers of Vaibhav Global are P N Gadgil Jewe., Ethos, Senco Gold, Goldiam Intl., Timex Group, KDDL Ltd, Rajesh Exports, D.P. Abhushan, Shringar House, and Shanti Gold.<BR><BR>Quality Snapshot: Excellent management risk is observed at P N Gadgil Jewe., Senco Gold, KDDL Ltd, D.P. Abhushan, Shringar House, and Shanti Gold, while Average management risk is found at Ethos, Goldiam Intl., Timex Group, Vaibhav Global, Rajesh Exports, and the rest. Growth is excellent for P N Gadgil Jewe., Ethos, Senco Gold, Timex Group, KDDL Ltd, D.P. Abhushan, Shringar House, and Shanti Gold, while Vaibhav Global and Rajesh Exports show below average growth, and Goldiam Intl. has average growth. For capital structure, excellent ratings are seen at Goldiam Intl., Vaibhav Global, Rajesh Exports, Shringar House, and the rest have good or below average ratings.<BR><BR>Return Snapshot: The peer with the highest 1-year return is Timex Group at 68.71%, while Rajesh Exports has the lowest at -60.66%. Vaibhav Global's 1-year return is -13.24%, which is higher than Rajesh Exports but lower than Timex Group. Additionally, peers with negative six-month returns include P N Gadgil Jewe., Ethos, Rajesh Exports, D.P. Abhushan, and Vaibhav Global.

View full answer

What does Vaibhav Global do?

10-Jun-2026

Vaibhav Global Ltd is a small-cap fashion retailer in the Gems, Jewellery, and Watches industry, with recent net sales of 935 Cr and a net profit of 91 Cr as of March 2026. The company, originally founded as Vaibhav Gems Limited in 1989, has a market cap of INR 3,810 Cr.

Overview:<BR>Vaibhav Global Ltd is a vertically integrated fashion retailer operating in the Gems, Jewellery and Watches industry, categorized as a Small Cap company.<BR><BR>History:<BR>The company was incorporated on May 8th, 1989, originally as Vaibhav Gems Limited, and later changed its name to Vaibhav Global Limited on November 29, 2012. The latest quarterly results reported net sales and net profit for the period ending March 2026.<BR><BR>Financial Snapshot:<BR>Most recent Net Sales: 935 Cr (Quarterly Results - Mar 2026) <BR>Most recent Net Profit: 91 Cr (Quarterly Results - Mar 2026) <BR>Market-cap value: INR 3,810 Cr (Small Cap)<BR><BR>Key Metrics:<BR>P/E: 14.00 <BR>Industry P/E: 42 <BR>Dividend Yield: 2.62% <BR>Debt-Equity: 0.02 <BR>Return on Equity: 16.14% <BR>Price to Book: 2.32 <BR><BR>Contact Details:<BR>Address: K-6B Fateh Tiba, Adarsh Nagar Fateh Tiba Jaipur Rajasthan : 302004 <BR>Tel: 91-141-2601020 <BR>Email: vgl@vaibhavgems.com <BR>Website: http://www.vaibhavglobal.com

View full answer

Should I buy, sell or hold Vaibhav Global Ltd?

23-May-2026

Are Vaibhav Global Ltd latest results good or bad?

22-May-2026

Vaibhav Global Ltd's latest results show a record quarterly net profit of ₹91.14 crores, up 167.43% year-on-year, but revenue declined 12.32% sequentially, and operating margins contracted significantly, indicating mixed performance with operational challenges that investors should consider.

Vaibhav Global Ltd's latest results present a mixed picture. On the positive side, the company reported its highest-ever quarterly net profit of ₹91.14 crores for Q4 FY26, reflecting a remarkable year-on-year growth of 167.43%. This impressive profit figure was significantly bolstered by a negative tax rate, which contributed ₹27.23 crores to the bottom line.<BR><BR>However, there are notable concerns regarding operational performance. The revenue for the quarter was ₹934.71 crores, which, while showing a year-on-year growth of 9.99%, marked a sequential decline of 12.32% from the previous quarter. This decline is typical for the March quarter due to seasonal factors in the television shopping and e-commerce jewellery business.<BR><BR>Additionally, the operating margin saw a significant contraction, falling to 8.92% from 12.73% in the preceding quarter. This volatility in margins raises questions about the sustainability of profitability moving forward. The company's return on equity stands at 12.66%, which is respectable but below the levels typically expected from a capital-light retail business.<BR><BR>In summary, while the net profit figures are strong, the underlying operational challenges, particularly regarding revenue and margin stability, suggest that the results are not entirely positive. Investors may need to approach with caution, considering both the impressive profit surge and the operational hurdles the company faces.

View full answer

Has Vaibhav Global Ltd declared dividend?

30-Jan-2026

Yes, Vaibhav Global Ltd has declared a dividend of 75% (₹1.5 per share) with an ex-date of February 3, 2026. Despite the dividend, total returns over various periods have shown significant price declines, indicating challenges in maintaining shareholder value.

Vaibhav Global Ltd has declared a dividend.<BR><BR>Dividend Details:<BR>- Percentage announced: 75%<BR>- Amount per share: 1.5<BR>- Ex-date: 03 Feb 26<BR><BR>Dividend Yield: 2.72%.<BR><BR>Total Returns by Period:<BR>In the last 3 months, the price return was -18.42%, the dividend return was 1.07%, resulting in a total return of -17.35%.<BR><BR>In the last 6 months, the price return was -4.61%, the dividend return was 1.98%, leading to a total return of -2.63%.<BR><BR>Over the past year, the price return was -20.12%, the dividend return was 2.75%, culminating in a total return of -17.37%.<BR><BR>In the last 2 years, the price return was -57.15%, the dividend return was 2.40%, which resulted in a total return of -54.75%.<BR><BR>For the last 3 years, the price return was -25.31%, the dividend return was 5.19%, giving a total return of -20.12%.<BR><BR>In the last 4 years, the price return was -51.8%, the dividend return was 5.50%, resulting in a total return of -46.3%.<BR><BR>Over the past 5 years, the price return was -56.99%, the dividend return was 4.11%, leading to a total return of -52.88%.<BR><BR>Overall, while Vaibhav Global Ltd has declared a dividend, the total returns over various periods indicate significant price declines, suggesting challenges in maintaining shareholder value despite the dividend payouts.

View full answer

Is Vaibhav Global technically bullish or bearish?

18-Nov-2025

As of November 17, 2025, Vaibhav Global's trend is mildly bullish due to positive weekly MACD and KST indicators, though caution is advised due to a bearish weekly RSI and mixed signals from Bollinger Bands.

As of 17 November 2025, the technical trend for Vaibhav Global has changed from bullish to mildly bullish. The current stance is mildly bullish, driven primarily by the weekly MACD and KST indicators, both of which are bullish. However, the weekly RSI is bearish, indicating some weakness in momentum. The daily moving averages remain bullish, supporting the mildly bullish outlook. The Bollinger Bands show a mixed signal with a mildly bullish stance on the weekly but bearish on the monthly. Overall, while there are positive indicators, the presence of bearish signals in the RSI suggests caution.

View full answer

How has been the historical performance of Vaibhav Global?

13-Nov-2025

Vaibhav Global has demonstrated consistent growth in net sales, increasing from 1,813.98 Cr in Mar'19 to 3,379.58 Cr in Mar'25, but profitability has faced challenges, with Profit After Tax declining from 154.17 Cr to 153.13 Cr during the same period. The company's total assets and liabilities have also grown significantly, reflecting a robust asset base despite some volatility in profit margins.

Answer:<BR>The historical performance of Vaibhav Global shows a consistent growth trend in net sales and profit over the years, with some fluctuations in profit margins. <BR><BR>Breakdown:<BR>Vaibhav Global's net sales have increased from 1,813.98 Cr in Mar'19 to 3,379.58 Cr in Mar'25, demonstrating a strong upward trajectory. The total operating income followed a similar trend, rising from 1,813.98 Cr in Mar'19 to 3,379.58 Cr in Mar'25. However, the operating profit margin has seen some volatility, peaking at 14.58% in Mar'21 before declining to 8.56% in Mar'25. Profit Before Tax also showed growth, increasing from 188.16 Cr in Mar'19 to 200.16 Cr in Mar'25, while Profit After Tax rose from 154.17 Cr in Mar'19 to 153.13 Cr in Mar'25, indicating a decline in profitability despite increased revenues. The company's total assets grew from 1,070.04 Cr in Mar'20 to 1,992.49 Cr in Mar'25, reflecting a robust asset base. Total liabilities also increased from 1,070.04 Cr in Mar'20 to 1,992.49 Cr in Mar'25, with total debt rising slightly from 64.43 Cr in Mar'20 to 113.95 Cr in Mar'25. Cash flow from operating activities peaked at 325 Cr in Mar'21 but decreased to 164 Cr in Mar'25, while net cash inflow turned positive at 29 Cr in Mar'25 after a negative outflow in the previous year. Overall, Vaibhav Global has shown significant growth in sales and assets, although profitability has faced challenges in recent years.

View full answer

Is Vaibhav Global overvalued or undervalued?

31-Oct-2025

As of October 30, 2025, Vaibhav Global is considered fairly valued with a PE ratio of 24.96, lower than its peers Page Industries and Jubilant Food, but has faced negative returns over the past few years.

As of 30 October 2025, the valuation grade for Vaibhav Global has moved from very attractive to attractive. The company is currently considered fairly valued. Key ratios include a PE ratio of 24.96, an EV to EBITDA of 14.63, and a PEG ratio of 0.62, which indicates a reasonable growth expectation relative to its price. <BR><BR>In comparison to its peers, Vaibhav Global's PE ratio is significantly lower than that of Page Industries, which stands at 59.73, and also lower than Jubilant Food's PE of 155.55. This suggests that while Vaibhav Global is priced attractively within its industry, it still faces challenges in terms of overall market performance, as evidenced by its negative returns over the past year and three years compared to the Sensex.

View full answer

When is the next results date for Vaibhav Global?

14-Oct-2025

Vaibhav Global will announce its results on 29 October 2025.

Vaibhav Global is scheduled to declare its results on 29 October 2025.

View full answer

Who are the top shareholders of the Vaibhav Global?

17-Jul-2025

The top shareholders of Vaibhav Global include Brett Enterprises Private Limited with 55.83%, Nalanda India Fund Limited at 7.6%, and individual investors holding 19.59%. Additionally, 101 Foreign Institutional Investors own 18.59%, while mutual funds have a minor stake of 0.1%, with no pledged promoter holdings reported.

The top shareholders of Vaibhav Global include Brett Enterprises Private Limited, which holds the largest stake at 55.83%. Other significant shareholders are Nalanda India Fund Limited, with a holding of 7.6%, and individual investors collectively owning 19.59%. Additionally, the company has 101 Foreign Institutional Investors (FIIs) holding 18.59% of the shares, while mutual funds have a minor stake through five schemes, accounting for 0.1%. There are no pledged promoter holdings reported.

View full answer
iScoreScore
Click here to find our call on this stock
Strong Sell
Sell
Hold
Buy
Strong Buy

Dashboard

1

The company is Net-Debt Free

 
2

Poor long term growth as Operating profit has grown by an annual rate -5.06% of over the last 5 years

 
3

Positive results in Mar 26

4

With ROE of 16.1, it has a Very Attractive valuation with a 2.5 Price to Book Value

5

Falling Participation by Institutional Investors

stock-summaryMojo Parameters

Mojo Parameters

Loading Valuation Snapshot...

Stock DNA

stock-summary
Industry

Gems, Jewellery And Watches

stock-summary
Market cap

INR 4,113 Cr (Small Cap)

stock-summary
P/E

15.00

stock-summary
Industry P/E

43

stock-summary
Dividend Yield

2.37%

stock-summary
Debt Equity

0.02

stock-summary
Return on Equity

16.14%

stock-summary
Price to Book

2.56

Revenue and Profits:
Net Sales:
935 Cr
(Quarterly Results - Mar 2026)
Net Profit:
91 Cr
stock-summaryTotal Returns
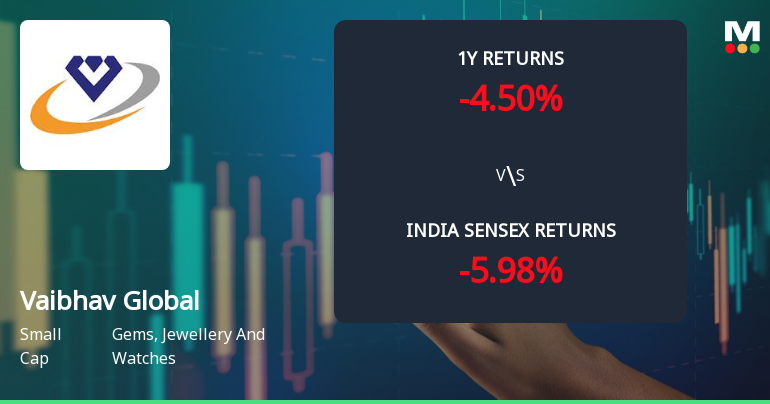
Total Returns (Price + Dividend) stock-summary
Dividend Yield (2.37%)
TimePeriod
Price Return
Dividend Return
Total Return
3 Months
20.26%
0.77%
21.03%
6 Months
2.69%
1.24%
3.93%
1 Year
4.01%
3.14%
7.15%
2 Years
-25.06%
3.17%
-21.89%
3 Years
-21.96%
5.33%
-16.63%
4 Years
-23.45%
7.32%
-16.13%
5 Years
-69.44%
3.66%
-65.78%

Latest dividend: 1.5 per share ex-dividend date: Feb-03-2026

Risk Adjusted Returns v/s stock-summary
Returns Beta
Icon
Beta has not been calculated since enough price history is not available
stock-summaryNews & Corporate Actions

Announcements stock-summary

Disclosure under Regulation 30A of LODR

17-Jun-2026 | Source : BSE

Intimation of Schedule of Analyst / Investor Meet.

Announcement under Regulation 30 (LODR)-Allotment of ESOP / ESPS

16-Jun-2026 | Source : BSE

Allotment of 91491 Equity Shares

Announcement under Regulation 30 (LODR)-Analyst / Investor Meet - Intimation

04-Jun-2026 | Source : BSE

Intimation of Schedule of Analysts / Investors Meet

Corporate Actions stock-summary

stock-summary
BOARD MEETING

No Upcoming Board Meetings

stock-summary
DIVIDEND

Vaibhav Global Ltd has declared 75% dividend, ex-date: 25 Jun 26

stock-summary
SPLITS

Vaibhav Global Ltd has announced 2:10 stock split, ex-date: 07 May 21

stock-summary
BONUS

No Bonus history available

stock-summary
RIGHTS

No Rights history available

stock-summaryKey Factors

Quality key factors stock-summary

Factor
Value
Sales Growth (5y)
7.77%
EBIT Growth (5y)
-5.06%
EBIT to Interest (avg)
19.31
Debt to EBITDA (avg)
0.80
Net Debt to Equity (avg)
0.02
Sales to Capital Employed (avg)
2.05
Tax Ratio
5.58%
Dividend Payout Ratio
16.25%
Pledged Shares
0
Institutional Holding
18.67%
ROCE (avg)
16.57%
ROE (avg)
13.16%

Valuation key factors

Factor
Value
P/E Ratio
15
Industry P/E
43
Price to Book Value
2.46
EV to EBIT
16.00
EV to EBITDA
11.41
EV to Capital Employed
2.44
EV to Sales
1.11
PEG Ratio
0.21
Dividend Yield
2.46%
ROCE (Latest)
15.26%
ROE (Latest)
16.14%

Technicals key factors

Indicator
Weekly
Monthly
MACD
Bullish
Mildly Bullish
RSI
No Signal
No Signal
Bollinger Bands
Bullish
Bullish
Moving Averages
Mildly Bearish (Daily)
KST
Bullish
Mildly Bullish
Dow Theory
Mildly Bullish
Mildly Bullish
OBV
Mildly Bullish
Mildly Bullish
stock-summary Technical Indicator Scale: Bearish, Mildly Bearish, Sideways, Mildly Bullish, Bullish  Turned 
stock-summaryShareholding
Shareholding Snapshot : Mar 2026stock-summary
Shareholding Compare (%holding) stock-summary
Majority shareholders

Promoters

Pledged Promoter Holdings

None

Mutual Funds

Held by 5 Schemes (0.11%)

FIIs

Held by 82 FIIs (16.44%)

Promoter with highest holding

Brett Enterprises Private Limited (55.97%)

Highest Public shareholder

Nalanda India Fund Limited (6.61%)

Individual Investors Holdings

20.33%

stock-summaryFinancial
[
  {
    "link": "quarterly",
    "btn_text": "All Quarterly Results",
    "header": "Quarterly Results Snapshot (Consolidated) - Mar'26 - YoY",
    "rhs": [
      {
        "prefix": "Net Sales ",
        "suffix": "YoY Growth in quarter ended Mar 2026 is 9.99% vs 7.66% in Mar 2025",
        "dir": 1
      },
      {
        "prefix": "Consolidated Net Profit ",
        "suffix": "YoY Growth in quarter ended Mar 2026 is 167.43% vs 58.96% in Mar 2025",
        "dir": 1
      }
    ],
    "table": {
      "header": [
        "Mar'26",
        "Mar'25",
        "Change(%)"
      ],
      "body": [
        {
          "field": "Net Sales",
          "val1": "934.71",
          "val2": "849.80",
          "chgp": "9.99%",
          "chgp_class": "positive"
        },
        {
          "field": "Operating Profit (PBDIT) excl Other Income",
          "val1": "83.42",
          "val2": "62.30",
          "chgp": "33.90%",
          "chgp_class": "positive"
        },
        {
          "field": "Interest",
          "val1": "4.31",
          "val2": "3.83",
          "chgp": "12.53%",
          "chgp_class": "negative"
        },
        {
          "field": "Exceptional Items",
          "val1": "0.18",
          "val2": "0.00",
          "chgp": "",
          "chgp_class": "neutral"
        },
        {
          "field": "Consolidate Net Profit",
          "val1": "91.14",
          "val2": "34.08",
          "chgp": "167.43%",
          "chgp_class": "positive"
        },
        {
          "field": "Operating Profit Margin (Excl OI)",
          "val1": "8.92%",
          "val2": "7.33%",
          "chgp": "1.59%",
          "chgp_class": "positive"
        }
      ]
    }
  },
  {
    "link": "half-yearly",
    "btn_text": "All Half Yearly Results",
    "header": "Half Yearly Results Snapshot (Consolidated) - Sep'25",
    "rhs": [
      {
        "prefix": "Net Sales ",
        "suffix": " Growth in half year ended Sep 2025 is 8.93% vs 13.88% in Sep 2024",
        "dir": -1
      },
      {
        "prefix": "Consolidated Net Profit ",
        "suffix": " Growth in half year ended Sep 2025 is 53.63% vs -6.10% in Sep 2024",
        "dir": 1
      }
    ],
    "table": {
      "header": [
        "Sep'25",
        "Sep'24",
        "Change(%)"
      ],
      "body": [
        {
          "field": "Net Sales",
          "val1": "1,691.05",
          "val2": "1,552.44",
          "chgp": "8.93%",
          "chgp_class": "positive"
        },
        {
          "field": "Operating Profit (PBDIT) excl Other Income",
          "val1": "139.12",
          "val2": "117.25",
          "chgp": "18.65%",
          "chgp_class": "positive"
        },
        {
          "field": "Interest",
          "val1": "6.91",
          "val2": "7.13",
          "chgp": "-3.09%",
          "chgp_class": "positive"
        },
        {
          "field": "Exceptional Items",
          "val1": "0.00",
          "val2": "0.00",
          "chgp": "",
          "chgp_class": "neutral"
        },
        {
          "field": "Consolidate Net Profit",
          "val1": "85.19",
          "val2": "55.45",
          "chgp": "53.63%",
          "chgp_class": "positive"
        },
        {
          "field": "Operating Profit Margin (Excl OI)",
          "val1": "8.23%",
          "val2": "7.55%",
          "chgp": "0.68%",
          "chgp_class": "positive"
        }
      ]
    }
  },
  {
    "link": "nine-monthly",
    "btn_text": "All Nine Monthly Results",
    "header": "Nine Monthly Results Snapshot (Consolidated) - Dec'25",
    "rhs": [
      {
        "prefix": "Net Sales ",
        "suffix": "YoY Growth in nine months ended Dec 2025 is 8.98% vs 12.36% in Dec 2024",
        "dir": -1
      },
      {
        "prefix": "Consolidated Net Profit ",
        "suffix": "YoY Growth in nine months ended Dec 2025 is 46.72% vs 12.01% in Dec 2024",
        "dir": 1
      }
    ],
    "table": {
      "header": [
        "Dec'25",
        "Dec'24",
        "Change(%)"
      ],
      "body": [
        {
          "field": "Net Sales",
          "val1": "2,757.08",
          "val2": "2,529.78",
          "chgp": "8.98%",
          "chgp_class": "positive"
        },
        {
          "field": "Operating Profit (PBDIT) excl Other Income",
          "val1": "274.81",
          "val2": "226.94",
          "chgp": "21.09%",
          "chgp_class": "positive"
        },
        {
          "field": "Interest",
          "val1": "10.63",
          "val2": "11.11",
          "chgp": "-4.32%",
          "chgp_class": "positive"
        },
        {
          "field": "Exceptional Items",
          "val1": "0.00",
          "val2": "0.00",
          "chgp": "",
          "chgp_class": "neutral"
        },
        {
          "field": "Consolidate Net Profit",
          "val1": "174.99",
          "val2": "119.27",
          "chgp": "46.72%",
          "chgp_class": "positive"
        },
        {
          "field": "Operating Profit Margin (Excl OI)",
          "val1": "9.97%",
          "val2": "8.97%",
          "chgp": "1.00%",
          "chgp_class": "positive"
        }
      ]
    }
  },
  {
    "link": "annual",
    "btn_text": "All Annual Results",
    "header": "Annual Results Snapshot (Consolidated) - Mar'26",
    "rhs": [
      {
        "prefix": "Net Sales ",
        "suffix": "YoY Growth in year ended Mar 2026 is 9.24% vs 11.14% in Mar 2025",
        "dir": -1
      },
      {
        "prefix": "Consolidated Net Profit ",
        "suffix": "YoY Growth in year ended Mar 2026 is 73.53% vs 19.90% in Mar 2025",
        "dir": 1
      }
    ],
    "table": {
      "header": [
        "Mar'26",
        "Mar'25",
        "Change(%)"
      ],
      "body": [
        {
          "field": "Net Sales",
          "val1": "3,691.79",
          "val2": "3,379.58",
          "chgp": "9.24%",
          "chgp_class": "positive"
        },
        {
          "field": "Operating Profit (PBDIT) excl Other Income",
          "val1": "358.24",
          "val2": "289.24",
          "chgp": "23.86%",
          "chgp_class": "positive"
        },
        {
          "field": "Interest",
          "val1": "14.94",
          "val2": "14.94",
          "chgp": "",
          "chgp_class": "neutral"
        },
        {
          "field": "Exceptional Items",
          "val1": "0.18",
          "val2": "0.00",
          "chgp": "",
          "chgp_class": "neutral"
        },
        {
          "field": "Consolidate Net Profit",
          "val1": "266.13",
          "val2": "153.36",
          "chgp": "73.53%",
          "chgp_class": "positive"
        },
        {
          "field": "Operating Profit Margin (Excl OI)",
          "val1": "9.70%",
          "val2": "8.56%",
          "chgp": "1.14%",
          "chgp_class": "positive"
        }
      ]
    }
  }
]

Quarterly Results Snapshot (Consolidated) - Mar'26 - YoYstock-summary

Mar'26
Mar'25
Change(%)
Net Sales
934.71
849.80
9.99%
Operating Profit (PBDIT) excl Other Income
83.42
62.30
33.90%
Interest
4.31
3.83
12.53%
Exceptional Items
0.18
0.00
Consolidate Net Profit
91.14
34.08
167.43%
Operating Profit Margin (Excl OI)
8.92%
7.33%
1.59%
Values in Rs Cr.
Direction Arrows
Net Sales

YoY Growth in quarter ended Mar 2026 is 9.99% vs 7.66% in Mar 2025

Direction Arrows
Consolidated Net Profit

YoY Growth in quarter ended Mar 2026 is 167.43% vs 58.96% in Mar 2025

Half Yearly Results Snapshot (Consolidated) - Sep'25stock-summary

Sep'25
Sep'24
Change(%)
Net Sales
1,691.05
1,552.44
8.93%
Operating Profit (PBDIT) excl Other Income
139.12
117.25
18.65%
Interest
6.91
7.13
-3.09%
Exceptional Items
0.00
0.00
Consolidate Net Profit
85.19
55.45
53.63%
Operating Profit Margin (Excl OI)
8.23%
7.55%
0.68%
Values in Rs Cr.
Direction Arrows
Net Sales

Growth in half year ended Sep 2025 is 8.93% vs 13.88% in Sep 2024

Direction Arrows
Consolidated Net Profit

Growth in half year ended Sep 2025 is 53.63% vs -6.10% in Sep 2024

Nine Monthly Results Snapshot (Consolidated) - Dec'25stock-summary

Dec'25
Dec'24
Change(%)
Net Sales
2,757.08
2,529.78
8.98%
Operating Profit (PBDIT) excl Other Income
274.81
226.94
21.09%
Interest
10.63
11.11
-4.32%
Exceptional Items
0.00
0.00
Consolidate Net Profit
174.99
119.27
46.72%
Operating Profit Margin (Excl OI)
9.97%
8.97%
1.00%
Values in Rs Cr.
Direction Arrows
Net Sales

YoY Growth in nine months ended Dec 2025 is 8.98% vs 12.36% in Dec 2024

Direction Arrows
Consolidated Net Profit

YoY Growth in nine months ended Dec 2025 is 46.72% vs 12.01% in Dec 2024

Annual Results Snapshot (Consolidated) - Mar'26stock-summary

Mar'26
Mar'25
Change(%)
Net Sales
3,691.79
3,379.58
9.24%
Operating Profit (PBDIT) excl Other Income
358.24
289.24
23.86%
Interest
14.94
14.94
Exceptional Items
0.18
0.00
Consolidate Net Profit
266.13
153.36
73.53%
Operating Profit Margin (Excl OI)
9.70%
8.56%
1.14%
Values in Rs Cr.
Direction Arrows
Net Sales

YoY Growth in year ended Mar 2026 is 9.24% vs 11.14% in Mar 2025

Direction Arrows
Consolidated Net Profit

YoY Growth in year ended Mar 2026 is 73.53% vs 19.90% in Mar 2025

stock-summaryCompany CV
About Vaibhav Global Ltd stock-summary
stock-summary
Vaibhav Global Ltd
Small Cap
Gems, Jewellery And Watches
Vaibhav Global Limited (VGL) (Formerly known Vaibhav Gems Limited) was incorporated in May 08th, 1989 at Jaipur. Later, the name of Company was changed from "Vaibhav Gems Limited" to "Vaibhav Global Limited" vide Certificate of Incorporation issued by Registrar of Companies, Rajasthan, on November 29, 2012. The Company is a vertically integrated fashion retailer with nearly four decades of industry experience.
Company Coordinates stock-summary
Company Details
K-6B Fateh Tiba, Adarsh Nagar Fateh Tiba Jaipur Rajasthan : 302004
stock-summary
Tel: 91-141-2601020
stock-summary
vgl@vaibhavgems.com
Registrar Details
Karvy Computershare Pvt Ltd., Karvy Selenium, Tower-B Plot No 31 & 32, Survey No 116/22, 115/24, 115/25, Financial District, Nanakramguda, Serilingampally, Mandal Ranga Reddy Dist, Hyderabad