
Compare Royal Cush. Vin. with Similar Stocks
Dashboard
With a Negative Book Value, the company has a Weak Long Term Fundamental Strength
- Poor long term growth as Net Sales has grown by an annual rate of -1.71% and Operating profit at 0% over the last 5 years
- The company has a negative book value of Rs 36.55 crore
With a fall in Net Sales of -21.65%, the company declared Very Negative results in Mar 26
Risky - Negative EBITDA
76.52% of Promoter Shares are Pledged
Below par performance in long term as well as near term
Stock DNA
Diversified consumer products
INR 56 Cr (Micro Cap)
NA (Loss Making)
36
0.00%
-2.30
21.75%
-1.54
Total Returns (Price + Dividend) 
Royal Cush. Vin. for the last several years.
Risk Adjusted Returns v/s
Returns Beta

News
Royal Cushion Vinyl Products Ltd is Rated Strong Sell
Royal Cushion Vinyl Products Ltd is rated Strong Sell by MarketsMOJO. This rating was last updated on 16 Sep 2024, reflecting a significant reassessment of the stock’s outlook. However, the analysis and financial metrics discussed here represent the company’s current position as of 18 June 2026, providing investors with the latest insights into its performance and prospects.
Read full news article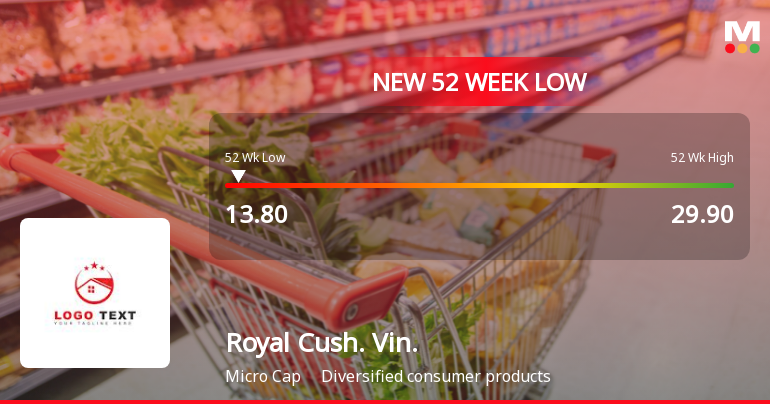
Royal Cushion Vinyl Products Ltd Falls to 52-Week Low of Rs 13.8 as Sell-Off Deepens
For the fifth consecutive session, Royal Cushion Vinyl Products Ltd closed lower, slipping to a fresh 52-week low of Rs 13.8 on 10 Jun 2026, extending a steep decline that has seen the stock lose nearly half its value over the past year.
Read full news article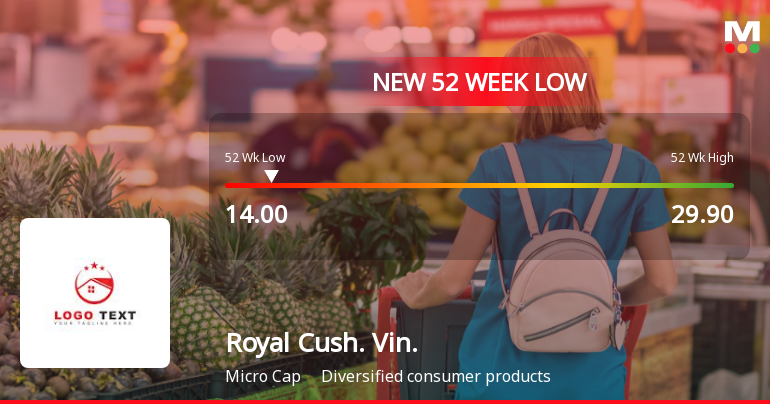
Five Consecutive Losses Push Royal Cushion Vinyl Products Ltd to a New 52-Week Low
For the fifth straight session, Royal Cushion Vinyl Products Ltd closed lower, breaching its 52-week low at Rs 14 on 9 Jun 2026, marking a steep decline of 53.18% from its 52-week high of Rs 29.9. This persistent downtrend has unfolded despite the broader market's mixed signals, highlighting stock-specific pressures that continue to weigh on investor sentiment.
Read full news article Announcements
Announcement under Regulation 30 (LODR)-Newspaper Publication
01-Jun-2026 | Source : BSEPursuant to Reg 30 & Reg 47 of SEBI (LODR) Regulations please find attached herewith copies of Newspaper Advertisement published in English in Financial Express and in Marathi in Mumbai Lakshadweep for intimating about the Board Meeting held on Friday 29th May 2026 approving the Audited Standalone Financial Results for the quarter and year ended as on 31st March 2026.
Board Meeting Outcome for Outcome Of The Board Meeting And Disclosures Of Events Held On 29Th May 2026 Pursuant To Regulation 30 Read With Schedule III Of The SEBI (LODR) 2015 As Amended From Time To Time.
29-May-2026 | Source : BSE1) Approved the Standalone Audited Financial Statements for the quarter and financial year ended on March 31 2026 as recommended by the Audit Committee. (Annexure A) (i) Audited Standalone Financial Results for the quarter and financial year ended March 31 2026. (ii) Auditors Report with unmodified opinion on the aforesaid Standalone Audited Financial Results (Annexure B). 2) The Board has appointed M/s. Shah and Kadam Chartered Accountant Vadodara Gujarat as Internal Auditor of the Company to conduct Internal Audit of the Company for the Financial Year 2026-27 based on the recommendations of the Audit Committee. 3) To approve Disclosures of Related Party Transactions pursuant to Regulation 23 (9) of SEBI (Listing Obligations & Disclosures Requirements) Regulation 2015 from 01/10/2025 to 31/03/2026. 4) To take on record Annual Secretarial Compliance Report received from M/s. Loya and Shariff for the year ended 31st March 2026. herewith as Annexure D.
General- Related Party Transaction For March 2026
29-May-2026 | Source : BSEPursuant to the Regulation 23 (9) of SEBI (LODR) Regulations 2015 please find enclosed herewith disclosure of Related Party Transactions in accordance with the applicable accounting standards for the half year ended March 2026.
Corporate Actions

No Upcoming Board Meetings

No Dividend history available

No Splits history available

No Bonus history available

No Rights history available
Quality key factors
Valuation key factors
Technicals key factors
 Technical Indicator Scale: Bearish, Mildly Bearish, Sideways, Mildly Bullish, Bullish Turned
 Shareholding Snapshot : Mar 2026
Shareholding Compare (%holding)
Non Institution
76.5241
Held by 4 Schemes (0.38%)
Held by 1 FIIs (0.01%)
Mahesh Kantilal Shah (8.7%)
Aurum Sme Trust I (4.78%)
43.0%
Quarterly Results Snapshot (Standalone) - Mar'26 - YoY

YoY Growth in quarter ended Mar 2026 is -21.65% vs -9.90% in Mar 2025
YoY Growth in quarter ended Mar 2026 is -108.71% vs -92.13% in Mar 2025
Half Yearly Results Snapshot (Standalone) - Sep'25
Growth in half year ended Sep 2025 is -4.58% vs 54.40% in Sep 2024
Growth in half year ended Sep 2025 is -191.26% vs -100.44% in Sep 2024
Nine Monthly Results Snapshot (Standalone) - Dec'25
YoY Growth in nine months ended Dec 2025 is -9.67% vs 28.55% in Dec 2024
YoY Growth in nine months ended Dec 2025 is -197.63% vs -101.09% in Dec 2024
Annual Results Snapshot (Standalone) - Mar'26
YoY Growth in year ended Mar 2026 is -12.49% vs 16.82% in Mar 2025
YoY Growth in year ended Mar 2026 is -446.72% vs -99.22% in Mar 2025
About Royal Cushion Vinyl Products Ltd

Company Coordinates


