
Compare Kuantum Papers with Similar Stocks
Dashboard
The company has declared Negative results for the last 10 consecutive quarters
- PBT LESS OI(Q) At Rs 17.45 cr has Fallen at -49.81%
- PAT(Q) At Rs 14.34 cr has Fallen at -45.1%
- INTEREST(Q) Highest at Rs 13.18 cr
Despite the size of the company, domestic mutual funds hold only 0.01% of the company
Consistent Underperformance against the benchmark over the last 3 years
Stock DNA
Paper, Forest & Jute Products
INR 665 Cr (Micro Cap)
16.00
17
3.87%
0.55
3.48%
0.56
Total Returns (Price + Dividend) 
Latest dividend: 3 per share ex-dividend date: Aug-22-2025
Risk Adjusted Returns v/s
Returns Beta

News
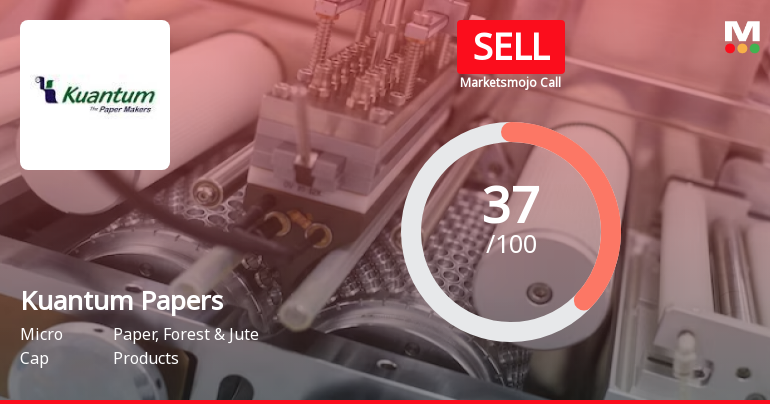
Kuantum Papers Ltd is Rated Sell by MarketsMOJO
Kuantum Papers Ltd is rated 'Sell' by MarketsMOJO, with this rating last updated on 07 Feb 2026. However, the analysis and financial metrics discussed here reflect the stock's current position as of 20 June 2026, providing investors with an up-to-date view of the company’s performance and outlook.
Read full news article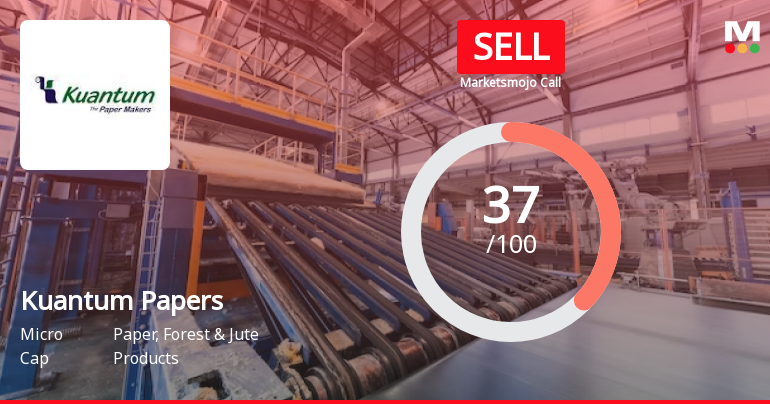
Kuantum Papers Ltd is Rated Sell by MarketsMOJO
Kuantum Papers Ltd is rated 'Sell' by MarketsMOJO, with this rating last updated on 07 February 2026. However, the analysis and financial metrics discussed here reflect the stock's current position as of 09 June 2026, providing investors with an up-to-date view of the company’s fundamentals, returns, and overall outlook.
Read full news article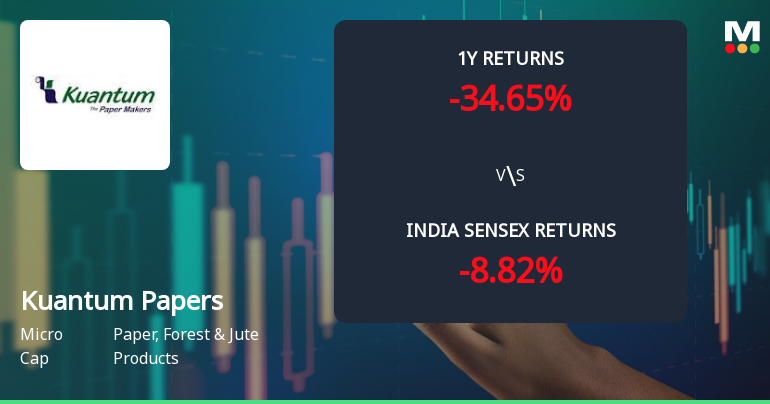
Kuantum Papers Ltd Technical Momentum Shifts Amid Bearish Sentiment
Kuantum Papers Ltd, a micro-cap player in the Paper, Forest & Jute Products sector, has experienced a nuanced shift in its technical momentum, moving from a strongly bearish stance to a mildly bearish outlook. Despite this slight improvement, the stock continues to face downward pressure, reflected in its recent price action and technical indicators, signalling a cautious environment for investors.
Read full news article Announcements
Announcement under Regulation 30 (LODR)-Investor Presentation
18-Jun-2026 | Source : BSEInvestor Presentation
Communication To Shareholders - Intimation On Tax Deduction On Dividend
17-Jun-2026 | Source : BSECommunication to Shareholders- Intimation of Tax Deduction on Dividend
Announcement under Regulation 30 (LODR)-Earnings Call Transcript
01-Jun-2026 | Source : BSEEarnings Call Transcript
Corporate Actions

No Upcoming Board Meetings

Kuantum Papers Ltd has declared 300% dividend, ex-date: 22 Aug 25

Kuantum Papers Ltd has announced 1:10 stock split, ex-date: 14 Jul 20

No Bonus history available

No Rights history available
Quality key factors
Valuation key factors
Technicals key factors
 Technical Indicator Scale: Bearish, Mildly Bearish, Sideways, Mildly Bullish, Bullish Turned
 Shareholding Snapshot : Mar 2026
Shareholding Compare (%holding)
Promoters
None
Held by 1 Schemes (0.0%)
Held by 3 FIIs (0.05%)
Kapedome Enterprises Limited (66.51%)
Chittorh Tradecom Private Limited (1.15%)
21.77%
Quarterly Results Snapshot (Standalone) - Mar'26 - YoY

YoY Growth in quarter ended Mar 2026 is 7.57% vs -6.59% in Mar 2025

YoY Growth in quarter ended Mar 2026 is -45.10% vs -22.93% in Mar 2025
Half Yearly Results Snapshot (Standalone) - Sep'25
Growth in half year ended Sep 2025 is -9.82% vs -9.02% in Sep 2024
Growth in half year ended Sep 2025 is -73.81% vs -36.83% in Sep 2024
Nine Monthly Results Snapshot (Standalone) - Dec'25
YoY Growth in nine months ended Dec 2025 is -4.31% vs -9.55% in Dec 2024
YoY Growth in nine months ended Dec 2025 is -69.00% vs -40.59% in Dec 2024
Annual Results Snapshot (Standalone) - Mar'26
YoY Growth in year ended Mar 2026 is -1.32% vs -8.82% in Mar 2025
YoY Growth in year ended Mar 2026 is -63.58% vs -37.34% in Mar 2025
About Kuantum Papers Ltd

Company Coordinates


