
Compare Supreme Infra. with Similar Stocks
Dashboard
Weak Long Term Fundamental Strength as the company has not declared results in the last 6 months
- Poor long term growth as Net Sales has grown by an annual rate of -17.60% over the last 5 years
- High Debt Company with a Debt to Equity ratio (avg) of 4.17 times
Risky - Negative EBITDA
Underperformed the market in the last 1 year
Stock DNA
Construction
INR 811 Cr (Micro Cap)
NA (Loss Making)
57
0.00%
4.17
-376.73%
2.30
Total Returns (Price + Dividend) 
Latest dividend: 1.5 per share ex-dividend date: Sep-03-2014
Risk Adjusted Returns v/s
Returns Beta

News

Supreme Infrastructure India Ltd Technical Momentum Shifts Amid Mixed Market Signals
Supreme Infrastructure India Ltd has experienced a notable shift in its technical momentum, moving from a mildly bearish stance to a sideways trend, reflecting a complex interplay of bullish and bearish signals across key technical indicators. Despite a recent downgrade to a Strong Sell rating by MarketsMOJO, the stock’s mixed technical profile warrants a detailed analysis for investors navigating the construction sector’s volatile landscape.
Read full news article
Supreme Infrastructure India Ltd is Rated Strong Sell
Supreme Infrastructure India Ltd is rated Strong Sell by MarketsMOJO. This rating was last updated on 08 Jan 2025. However, the analysis and financial metrics presented here reflect the company’s current position as of 01 July 2026, providing investors with an up-to-date view of the stock’s fundamentals, returns, and market standing.
Read full news article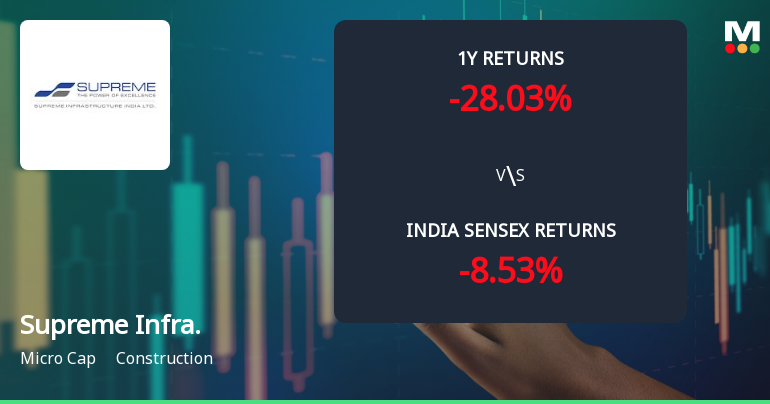
Supreme Infrastructure India Ltd Sees Mixed Technical Signals Amid Price Momentum Shift
Supreme Infrastructure India Ltd has experienced a notable shift in price momentum, reflected in a 14.78% surge in its share price to ₹79.97 on 1 Jul 2026. Despite this sharp intraday gain, technical indicators present a complex picture, with a blend of mildly bullish and bearish signals across weekly and monthly timeframes, underscoring a cautious outlook for investors in this micro-cap construction sector stock.
Read full news article Announcements
Board Meeting Intimation for To Consider And Approve The Financial Results For The Period Ended March 31 2026
24-Jun-2026 | Source : BSESupreme Infrastructure India Ltdhas informed BSE that the meeting of the Board of Directors of the Company is scheduled on 04/07/2026 inter alia to consider and approve To consider and approve the financial results for the period ended March 31 2026
Disclosure Under Regulation 30 Of SEBI (Listing Obligations And Disclosure Requirements) Regulations 2015 - Receipt Of Listing Approval From BSE Limited.
19-Jun-2026 | Source : BSEListing of 767000 Equity Shares of Rs. 10/- each issued to non Non-promoter on preferential basis pursuant to conversion of warrants.
Announcement under Regulation 30 (LODR)-Scheme of Arrangement
15-Jun-2026 | Source : BSEUpdate on Implementation of Scheme of Arrangement/ Compromise under section 230 of the Companies Act 2013 with lenders.
Corporate Actions

04 Jul 2026

Supreme Infrastructure India Ltd has declared 15% dividend, ex-date: 03 Sep 14

No Splits history available

No Bonus history available

No Rights history available
Quality key factors
Valuation key factors
Technicals key factors
 Technical Indicator Scale: Bearish, Mildly Bearish, Sideways, Mildly Bullish, Bullish Turned
 Shareholding Snapshot : Mar 2026
Shareholding Compare (%holding)
Promoters
12.4366
Held by 0 Schemes
Held by 6 FIIs (3.0%)
Supreme Lake View Bungalows Private Limited (11.03%)
Kitara Piin 1103 (6.32%)
12.8%
Quarterly Results Snapshot (Consolidated) - Dec'25 - QoQ

QoQ Growth in quarter ended Dec 2025 is 119.41% vs 62.26% in Sep 2025

QoQ Growth in quarter ended Dec 2025 is -100.78% vs 1,676.84% in Sep 2025
Half Yearly Results Snapshot (Consolidated) - Sep'25
Growth in half year ended Sep 2025 is -40.78% vs 47.38% in Sep 2024
Growth in half year ended Sep 2025 is 953.84% vs -15.17% in Sep 2024
Nine Monthly Results Snapshot (Consolidated) - Dec'25
YoY Growth in nine months ended Dec 2025 is 16.91% vs 30.13% in Dec 2024
YoY Growth in nine months ended Dec 2025 is 655.90% vs -16.06% in Dec 2024
Annual Results Snapshot (Consolidated) - Mar'25
YoY Growth in year ended Mar 2025 is 12.67% vs -39.22% in Mar 2024
YoY Growth in year ended Mar 2025 is -21.43% vs -1.45% in Mar 2024
About Supreme Infrastructure India Ltd

Company Coordinates


