
Compare Bosch with Similar Stocks
Dashboard
The company is Net-Debt Free
Healthy long term growth as Net Sales has grown by an annual rate of 15.57% and Operating profit at 22.46%
With ROE of 15.7, it has a Fair valuation with a 8 Price to Book Value
High Institutional Holdings at 22.28%
Company is among the highest 1% of companies rated by MarketsMojo across all 4,000 stocks
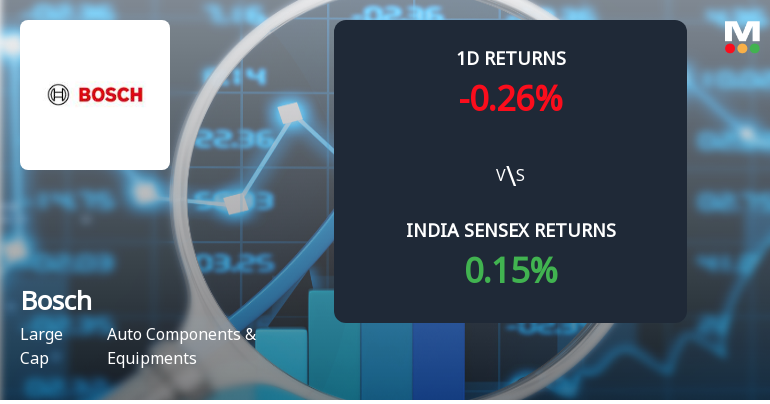
Market Beating performance in long term as well as near term
Stock DNA
Auto Components & Equipments
INR 121,023 Cr (Large Cap)
51.00
37
1.31%
-0.17
15.68%
8.04
Total Returns (Price + Dividend) 
Latest dividend: 512 per share ex-dividend date: Jul-29-2025
Risk Adjusted Returns v/s
Returns Beta

News
Bosch Ltd Sees Significant Open Interest Surge Amidst Mixed Market Signals
Bosch Ltd., a leading player in the Auto Components & Equipments sector, has witnessed a notable surge in open interest (OI) in its derivatives segment, signalling increased market activity and potential directional bets. The stock’s recent performance, combined with evolving volume patterns and positioning, offers valuable insights for investors navigating the current market landscape.
Read full news article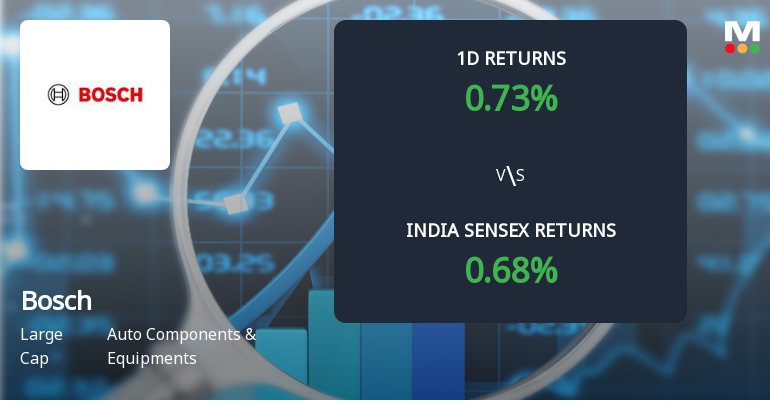
Bosch Ltd Sees Significant Open Interest Surge Amid Derivatives Activity
Bosch Ltd., a leading player in the Auto Components & Equipments sector, has witnessed a notable surge in open interest (OI) in its derivatives segment, signalling increased market participation and potential directional bets. The stock’s recent price action, combined with rising volumes and improved mojo ratings, suggests growing investor confidence amid a cautiously optimistic outlook.
Read full news article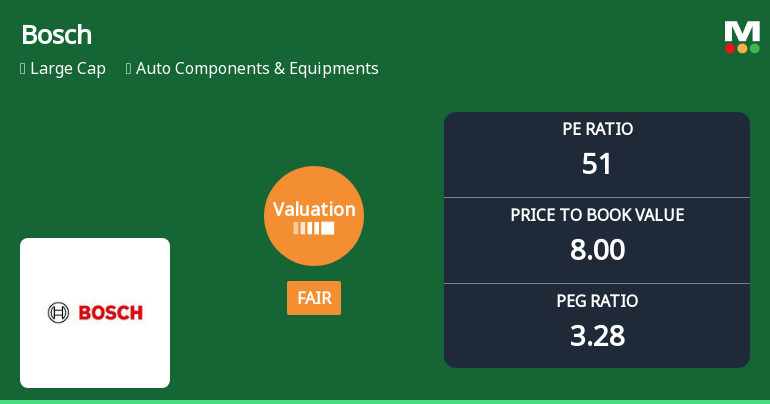
Bosch Ltd. Valuation Shifts to Fair; P/E and P/BV Metrics Signal Improved Price Attractiveness
Bosch Ltd., a stalwart in the Auto Components & Equipments sector, has recently undergone a notable shift in its valuation parameters, moving from an expensive to a fair valuation grade. This transition, accompanied by a Mojo Grade upgrade from Hold to Buy, reflects evolving market perceptions and improved price attractiveness amid robust financial metrics and strong relative returns against the Sensex.
Read full news article Announcements
Announcement under Regulation 30 (LODR)-Newspaper Publication
22-Jun-2026 | Source : BSEIntimation under Reg(47) of SEBI LODR -Newspaper Publication regarding notice of loss of share certificate(s)
Announcement under Regulation 30 (LODR)-Newspaper Publication
19-Jun-2026 | Source : BSEIntimation under Regulation 47 of SEBI (Listing Obligations and Disclosure Requirements) Regulations 2015- Publication of Newspaper Notice dated 18.06.2026 pursuant to IEPF (Accounting Audit Transfer and Refund) Rules 2016.
Disclosure Under Regulation 6(2) And 7(2)(A) Of SEBI (PIT) Regulations 2015
12-Jun-2026 | Source : BSEDisclosure under Regulation 6(2) and 7(2)(a) of SEBI (PIT) Regulations 2015
Corporate Actions

No Upcoming Board Meetings

Bosch Ltd. has declared 5120% dividend, ex-date: 29 Jul 25

No Splits history available

No Bonus history available

No Rights history available
Quality key factors
Valuation key factors
Technicals key factors
 Technical Indicator Scale: Bearish, Mildly Bearish, Sideways, Mildly Bullish, Bullish Turned
 Shareholding Snapshot : Mar 2026
Shareholding Compare (%holding)
Promoters
None
Held by 29 Schemes (6.49%)
Held by 561 FIIs (7.22%)
Robert Bosch Internationale Beteiligungen Ag (67.76%)
Hdfc Mutual Fund Various Schemes (3.7%)
5.76%
Quarterly Results Snapshot (Consolidated) - Mar'26 - QoQ

QoQ Growth in quarter ended Mar 2026 is 13.92% vs 1.89% in Dec 2025
QoQ Growth in quarter ended Mar 2026 is 7.02% vs -3.95% in Dec 2025
Half Yearly Results Snapshot (Consolidated) - Sep'25
Growth in half year ended Sep 2025 is 10.01% vs 5.10% in Sep 2024
Growth in half year ended Sep 2025 is 66.56% vs -28.82% in Sep 2024
Nine Monthly Results Snapshot (Consolidated) - Dec'25
YoY Growth in nine months ended Dec 2025 is 9.81% vs 5.47% in Dec 2024
YoY Growth in nine months ended Dec 2025 is 50.73% vs -24.16% in Dec 2024
Annual Results Snapshot (Consolidated) - Mar'26
YoY Growth in year ended Mar 2026 is 10.77% vs 8.13% in Mar 2025
YoY Growth in year ended Mar 2026 is 37.61% vs -19.11% in Mar 2025
About Bosch Ltd.

Company Coordinates


