
Compare GTT Data with Similar Stocks
Dashboard
With a Operating Losses, the company has a Weak Long Term Fundamental Strength
- Poor long term growth as Operating profit has grown by an annual rate -306.88% of over the last 5 years
- Low ability to service debt as the company has a high Debt to EBITDA ratio of -12.36 times
Flat results in Mar 26
Risky - Negative EBITDA
Underperformed the market in the last 1 year
Stock DNA
Media & Entertainment
INR 201 Cr (Micro Cap)
NA (Loss Making)
21
0.00%
0.42
-22.68%
2.57
Total Returns (Price + Dividend) 
GTT Data for the last several years.
Risk Adjusted Returns v/s
Returns Beta

News

GTT Data Solutions Ltd is Rated Strong Sell
GTT Data Solutions Ltd is rated Strong Sell by MarketsMOJO. This rating was last updated on 06 Jan 2026. However, the analysis and financial metrics discussed here reflect the company’s current position as of 28 July 2026, providing investors with an up-to-date view of the stock’s fundamentals, valuation, financial trends, and technical outlook.
Read full news article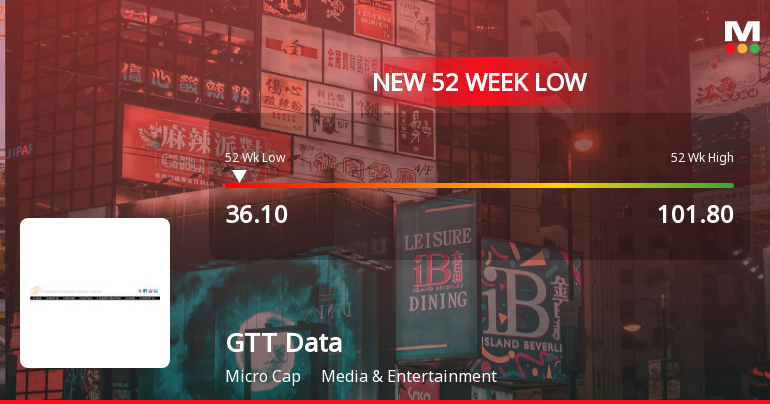
Markets Rally, But GTT Data Solutions Ltd Sinks to 52-Week Low in Stock-Specific Sell-Off
Despite broader market resilience, GTT Data Solutions Ltd has plunged to a fresh 52-week low of Rs 36.1 on 22 Jul 2026, marking a near 50% decline over the past year and underscoring persistent headwinds for the micro-cap media company.
Read full news article
GTT Data Solutions Ltd is Rated Strong Sell
GTT Data Solutions Ltd is rated Strong Sell by MarketsMOJO. This rating was last updated on 06 Jan 2026, reflecting a significant reassessment of the stock’s outlook. However, all fundamentals, returns, and financial metrics discussed below are current as of 17 July 2026, providing investors with an up-to-date analysis of the company’s position.
Read full news article Announcements
Compliances-Certificate under Reg. 74 (5) of SEBI (DP) Regulations 2018
13-Jul-2026 | Source : BSECertificate under Reg. 74(5) of SEBI (Depository Participants) Regulations2018.
Announcement under Regulation 30 (LODR)-Newspaper Publication
04-Jul-2026 | Source : BSENewspaper publication in respect of Postal Ballot
Shareholder Meeting / Postal Ballot-Notice of Postal Ballot
02-Jul-2026 | Source : BSENotice of Postal Ballot
Corporate Actions

No Upcoming Board Meetings

No Dividend history available

No Splits history available

No Bonus history available

GTT Data Solutions Ltd has announced 1:1 rights issue, ex-date: 14 Jan 25
Quality key factors
Valuation key factors
Technicals key factors
 Technical Indicator Scale: Bearish, Mildly Bearish, Sideways, Mildly Bullish, Bullish Turned
 Shareholding Snapshot : Jun 2026
Shareholding Compare (%holding)
Promoters
None
Held by 1 Schemes (0.01%)
Held by 1 FIIs (0.0%)
U.g.patwardhan Services Pvt.ltd. (17.71%)
Vijay Mukund Jog (2.49%)
24.85%
Quarterly Results Snapshot (Consolidated) - Mar'26 - QoQ

QoQ Growth in quarter ended Mar 2026 is -31.27% vs 14.63% in Dec 2025
QoQ Growth in quarter ended Mar 2026 is -419.59% vs -84.76% in Dec 2025
Half Yearly Results Snapshot (Standalone) - Sep'25

Growth in half year ended Sep 2025 is 4,766.67% vs 0.00% in Sep 2024
Growth in half year ended Sep 2025 is -195.24% vs -4,100.00% in Sep 2024
Nine Monthly Results Snapshot (Standalone) - Dec'25
YoY Growth in nine months ended Dec 2025 is 1,006.62% vs 0.00% in Dec 2024
YoY Growth in nine months ended Dec 2025 is -38.31% vs -8,200.00% in Dec 2024
Annual Results Snapshot (Consolidated) - Mar'26
YoY Growth in year ended Mar 2026 is 726.53% vs 16.21% in Mar 2025
YoY Growth in year ended Mar 2026 is -135.01% vs -424.81% in Mar 2025
About GTT Data Solutions Ltd

Company Coordinates


