
Compare Max Heights with Similar Stocks
Dashboard
Weak Long Term Fundamental Strength with an average Return on Capital Employed (ROCE) of 1.92%
- Poor long term growth as Operating profit has grown by an annual rate 13.58% of over the last 5 years
- Low ability to service debt as the company has a high Debt to EBITDA ratio of 2.43 times
Flat results in Mar 26
Below par performance in long term as well as near term
Total Returns (Price + Dividend) 
Latest dividend: 0 per share ex-dividend date: Jan-07-2016
Risk Adjusted Returns v/s
Returns Beta

News
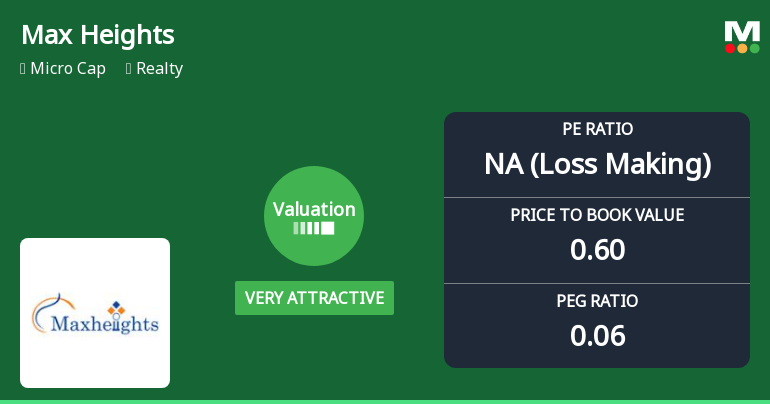
Max Heights Infrastructure Ltd Valuation Turns Very Attractive Amid Market Challenges
Max Heights Infrastructure Ltd, a micro-cap player in the Realty sector, has seen a significant shift in its valuation parameters, moving from a fair to a very attractive rating. Despite ongoing headwinds reflected in its share price performance and modest returns relative to the broader market, the company’s price-to-earnings and price-to-book ratios now present compelling entry points for investors willing to navigate the sector’s volatility.
Read full news article
Max Heights Infrastructure Ltd: Valuation Shifts Signal Changing Price Attractiveness
Max Heights Infrastructure Ltd, a micro-cap player in the Realty sector, has seen a notable shift in its valuation parameters, moving from a very attractive to a fair valuation grade. This change reflects evolving market perceptions amid mixed financial metrics and a challenging industry backdrop, prompting investors to reassess the stock’s price attractiveness relative to its peers and historical benchmarks.
Read full news article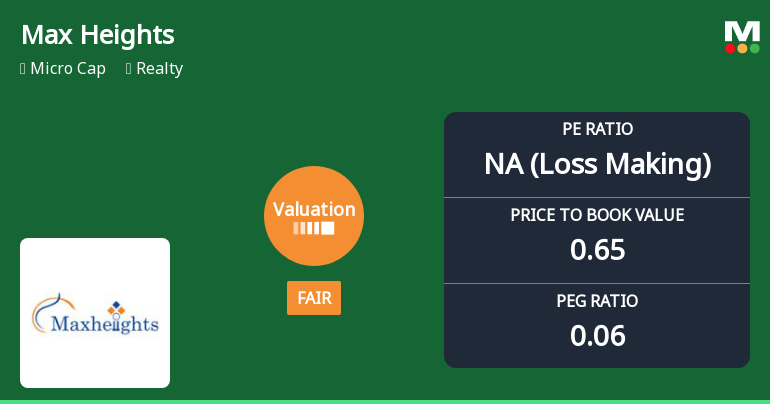
Max Heights Infrastructure Ltd: Valuation Shifts Signal Changing Price Attractiveness
Max Heights Infrastructure Ltd, a micro-cap player in the Realty sector, has witnessed a notable shift in its valuation parameters, moving from a very attractive to a fair valuation grade. This change, coupled with its recent market performance and peer comparisons, offers investors a nuanced perspective on the stock’s price attractiveness and potential investment appeal.
Read full news article Announcements
Compliances-Certificate under Reg. 74 (5) of SEBI (DP) Regulations 2018
04-Jul-2026 | Source : BSESubmission of certificate issued by Skyline Financial Services Private Limited Registrar and Share Transfer Agent of the company dated 01st July 2026.
Closure of Trading Window
24-Jun-2026 | Source : BSESubmission of Closure of Trading Window
Reply To Clarification Sought For Price Movement From Max Heights Infrastucture Limited
18-Jun-2026 | Source : BSEPlease find attached the reply in respect to BSE Email dated 17th June 2026 seeking clarification on the price movement.
Corporate Actions

No Upcoming Board Meetings


No Splits history available

No Bonus history available

No Rights history available
Quality key factors
Valuation key factors
Technicals key factors
 Technical Indicator Scale: Bearish, Mildly Bearish, Sideways, Mildly Bullish, Bullish Turned
 Shareholding Snapshot : Mar 2026
Shareholding Compare (%holding)
Promoters
None
Held by 0 Schemes
Held by 0 FIIs
Mansi Narang (17.84%)
Ranjitgarh Finance Company Private Limited (5.59%)
28.07%
Quarterly Results Snapshot (Standalone) - Mar'26 - YoY

YoY Growth in quarter ended Mar 2026 is 21.62% vs -85.14% in Mar 2025
YoY Growth in quarter ended Mar 2026 is -28.57% vs -160.87% in Mar 2025
Half Yearly Results Snapshot (Standalone) - Sep'25
Growth in half year ended Sep 2025 is 105.15% vs -76.48% in Sep 2024
Growth in half year ended Sep 2025 is 1,350.00% vs -150.00% in Sep 2024
Nine Monthly Results Snapshot (Standalone) - Dec'25
YoY Growth in nine months ended Dec 2025 is 99.14% vs -76.46% in Dec 2024
YoY Growth in nine months ended Dec 2025 is 1,216.67% vs 20.00% in Dec 2024
Annual Results Snapshot (Standalone) - Mar'26
YoY Growth in year ended Mar 2026 is 80.57% vs -79.38% in Mar 2025
YoY Growth in year ended Mar 2026 is 345.00% vs -229.03% in Mar 2025
About Max Heights Infrastructure Ltd

Company Coordinates


