
Compare Std. Capital Mkt with Similar Stocks
Stock DNA
Non Banking Financial Company (NBFC)
INR 96 Cr (Micro Cap)
1.00
21
0.00%
5.01
18.57%
0.22
Total Returns (Price + Dividend) 
Latest dividend: 0.01 per share ex-dividend date: May-13-2024
Risk Adjusted Returns v/s
Returns Beta

News
Standard Capital Markets Ltd is Rated Sell
Standard Capital Markets Ltd is rated Sell by MarketsMOJO. This rating was last updated on 16 Sep 2025. However, the analysis and financial metrics discussed here reflect the stock’s current position as of 28 June 2026, providing investors with an up-to-date view of the company’s fundamentals, valuation, financial trends, and technical outlook.
Read full news article
Standard Capital Markets Ltd is Rated Sell
Standard Capital Markets Ltd is rated Sell by MarketsMOJO. This rating was last updated on 16 Sep 2025, reflecting a shift from the previous 'Hold' status. However, all fundamentals, returns, and financial metrics discussed here are current as of 16 June 2026, providing investors with an up-to-date view of the stock's position.
Read full news article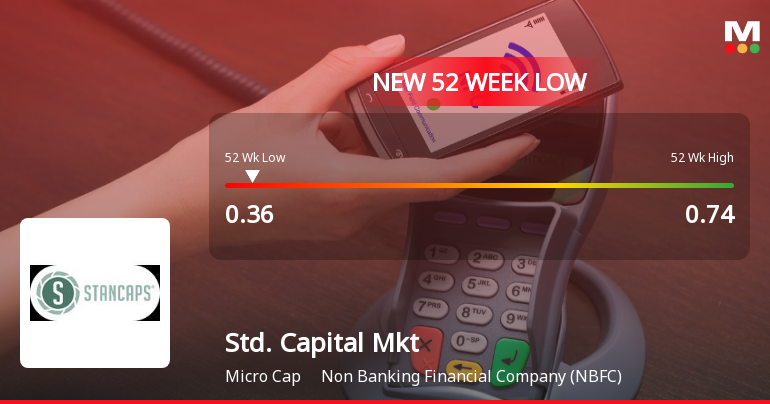
Standard Capital Markets Ltd Falls to 52-Week Low of Rs 0.36 as Sell-Off Deepens
For the fifth consecutive session, Standard Capital Markets Ltd closed lower, slipping to a fresh 52-week low of Rs 0.36 on 8 Jun 2026. This decline comes despite the company reporting a remarkable surge in quarterly sales and profits, highlighting a disconnect between financial performance and market sentiment.
Read full news article Announcements
Compliances-Reg.24(A)-Annual Secretarial Compliance
30-May-2026 | Source : BSEPlease find enclosed herewith Annual Secreatial Compliance Report of the Company issued by Virender Kumar & Associates for the Financial ended 31st March 2026
Board Meeting Outcome for OUTCOME OF BOARD MEETING HELD ON FRIDAY 29TH MAY 2026 AND AUDITED FINANCIAL RESULTS FOR THE QUARTER AND YEAR ENDED MARCH 31 2026.
29-May-2026 | Source : BSEPursuant to Regulation 30 & 33 of SEBI (Listing Obligations and Disclosure Requirements) Regulations 2015 we would like to inform you that the Board of Directors in their meeting held Today i:e on Friday 29th May 2026 has inter-alia considered recommended and approved the following:
AUDITED FINANCIAL RESULTS FOR THE QUARTER AND YEAR ENDED MARCH 31 2026.
29-May-2026 | Source : BSEThe Board of Director of the Company consider and approved the Audited Financial Result for the Quater and year ended 31st March 2026
Corporate Actions

No Upcoming Board Meetings

Standard Capital Markets Ltd has declared 1% dividend, ex-date: 13 May 24

Standard Capital Markets Ltd has announced 1:10 stock split, ex-date: 29 Dec 23

Standard Capital Markets Ltd has announced 2:1 bonus issue, ex-date: 29 Dec 23

No Rights history available
Quality key factors
Valuation key factors
Technicals key factors
 Technical Indicator Scale: Bearish, Mildly Bearish, Sideways, Mildly Bullish, Bullish Turned
 Shareholding Snapshot : Mar 2026
Shareholding Compare (%holding)
Non Institution
None
Held by 0 Schemes
Held by 0 FIIs
Gaurav Jindal (2.59%)
Flash Merchandise Private Limited (15.67%)
59.8%
Quarterly Results Snapshot (Consolidated) - Mar'26 - QoQ

QoQ Growth in quarter ended Mar 2026 is 232.78% vs -31.36% in Dec 2025

QoQ Growth in quarter ended Mar 2026 is 130.92% vs 174.11% in Dec 2025
Half Yearly Results Snapshot (Standalone) - Sep'25
Growth in half year ended Sep 2025 is 581.53% vs 61.63% in Sep 2024
Growth in half year ended Sep 2025 is -2,675.42% vs -75.92% in Sep 2024
Nine Monthly Results Snapshot (Standalone) - Dec'25
YoY Growth in nine months ended Dec 2025 is 570.66% vs 42.46% in Dec 2024
YoY Growth in nine months ended Dec 2025 is 107.89% vs -632.24% in Dec 2024
Annual Results Snapshot (Consolidated) - Mar'26
YoY Growth in year ended Mar 2026 is 302.96% vs 228.80% in Mar 2025
YoY Growth in year ended Mar 2026 is 186.86% vs 160.13% in Mar 2025
About Standard Capital Markets Ltd

Company Coordinates


