
Compare Transcorp Intl. with Similar Stocks
Dashboard
Weak Long Term Fundamental Strength with an average Return on Equity (ROE) of 9.19%
- Poor long term growth as Net Sales has grown by an annual rate of -0.70%
The company declared positive results in Mar'26 after flat results in Dec'25
With ROE of 11.5, it has a Very Attractive valuation with a 1.2 Price to Book Value
Majority shareholders : Promoters
Stock DNA
Non Banking Financial Company (NBFC)
INR 87 Cr (Micro Cap)
10.00
23
1.80%
0.20
11.48%
1.22
Total Returns (Price + Dividend) 
Latest dividend: 0.2 per share ex-dividend date: Nov-10-2025
Risk Adjusted Returns v/s
Returns Beta

News

Transcorp International Ltd is Rated Hold
Transcorp International Ltd is rated 'Hold' by MarketsMOJO, with this rating last updated on 21 May 2026. However, the analysis and financial metrics discussed here reflect the stock's current position as of 16 June 2026, providing investors with the latest insights into its performance and outlook.
Read full news article
Transcorp International Ltd is Rated Hold
Transcorp International Ltd is rated 'Hold' by MarketsMOJO, with this rating last updated on 21 May 2026. However, the analysis and financial metrics discussed here reflect the stock's current position as of 03 June 2026, providing investors with an up-to-date perspective on its performance and outlook.
Read full news article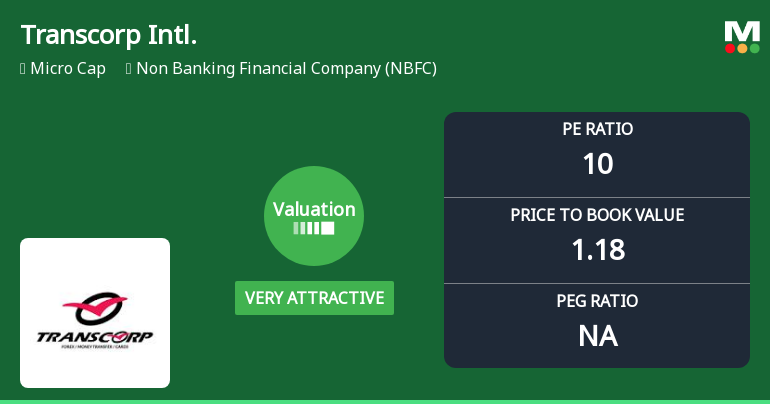
Transcorp International Ltd Valuation Shifts Signal Renewed Price Attractiveness
Transcorp International Ltd, a micro-cap player in the Non Banking Financial Company (NBFC) sector, has seen a notable shift in its valuation parameters, moving from a fair to a very attractive rating. This change comes amid a backdrop of mixed market returns and sector-specific challenges, prompting investors to reassess the stock’s price attractiveness relative to its historical and peer averages.
Read full news article Announcements
Reg. 34 (1) Annual Report.
19-Jun-2026 | Source : BSE31st Annual Report FY 2025-26
Notice Of 31St Annual General Meeting
19-Jun-2026 | Source : BSENotice of 31st Annual General Meeting of Transcorp International Limited
Record Date & Book Closure
19-Jun-2026 | Source : BSEIntimation of Record date & Book closure for the purpose of Dividend and E-voting for 31st Annual General Meeting
Corporate Actions

No Upcoming Board Meetings

Transcorp International Ltd has declared 20% dividend, ex-date: 03 Jul 26

Transcorp International Ltd has announced 2:10 stock split, ex-date: 13 May 16

Transcorp International Ltd has announced 1:4 bonus issue, ex-date: 19 Jun 18

No Rights history available
Quality key factors
Valuation key factors
Technicals key factors
 Technical Indicator Scale: Bearish, Mildly Bearish, Sideways, Mildly Bullish, Bullish Turned
 Shareholding Snapshot : Mar 2026
Shareholding Compare (%holding)
Promoters
None
Held by 0 Schemes
Held by 1 FIIs (0.0%)
Bhoruka Investment Limited (37.93%)
Vitro Suppliers Pvt Ltd (5.17%)
15.78%
Quarterly Results Snapshot (Consolidated) - Mar'26 - QoQ

QoQ Growth in quarter ended Mar 2026 is -7.27% vs -15.19% in Dec 2025
QoQ Growth in quarter ended Mar 2026 is 123.43% vs 2.34% in Dec 2025
Half Yearly Results Snapshot (Consolidated) - Sep'25

Growth in half year ended Sep 2025 is -46.01% vs -28.54% in Sep 2024
Growth in half year ended Sep 2025 is -72.84% vs 936.08% in Sep 2024
Nine Monthly Results Snapshot (Consolidated) - Dec'25
YoY Growth in nine months ended Dec 2025 is -41.44% vs -33.87% in Dec 2024
YoY Growth in nine months ended Dec 2025 is -47.23% vs 189.76% in Dec 2024
Annual Results Snapshot (Consolidated) - Mar'26
YoY Growth in year ended Mar 2026 is -38.07% vs -33.25% in Mar 2025
YoY Growth in year ended Mar 2026 is -17.50% vs 16,850.00% in Mar 2025
About Transcorp International Ltd

Company Coordinates


