
Compare Bharat Bijlee with Similar Stocks
Dashboard
Company has a Debt to Equity ratio (avg) of 0.08 times
Healthy long term growth as Net Sales has grown by an annual rate of 25.48% and Operating profit at 38.40%
Flat results in Mar 26
With ROE of 5.9, it has a Attractive valuation with a 1.6 Price to Book Value
High Institutional Holdings at 22.06%
Stock DNA
Other Electrical Equipment
INR 3,213 Cr (Small Cap)
27.00
46
1.23%
0.02
5.92%
1.59
Total Returns (Price + Dividend) 
Latest dividend: 35 per share ex-dividend date: Sep-04-2025
Risk Adjusted Returns v/s
Returns Beta

News
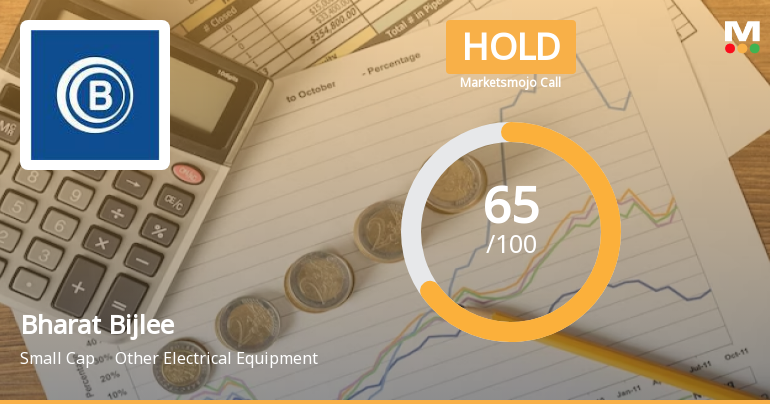
Bharat Bijlee Ltd is Rated Hold by MarketsMOJO
Bharat Bijlee Ltd is rated 'Hold' by MarketsMOJO, with this rating last updated on 15 June 2026. While the rating change occurred on that date, the analysis and financial metrics discussed here reflect the stock's current position as of 27 June 2026, providing investors with the latest insights into the company’s fundamentals, valuation, financial trends, and technical outlook.
Read full news article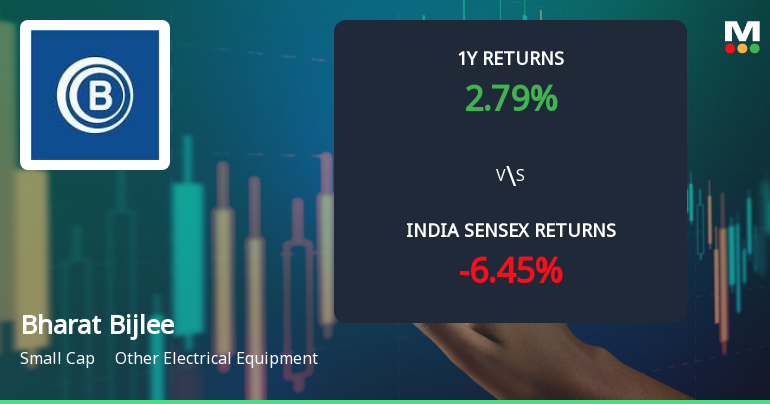
Bharat Bijlee Ltd Technical Momentum Shifts Signal Mildly Bullish Outlook
Bharat Bijlee Ltd has demonstrated a notable shift in technical momentum, moving from a mildly bearish stance to a mildly bullish outlook. This change is underpinned by a combination of bullish signals across key technical indicators, including MACD, moving averages, and Bollinger Bands, signalling renewed investor interest in this small-cap player within the Other Electrical Equipment sector.
Read full news article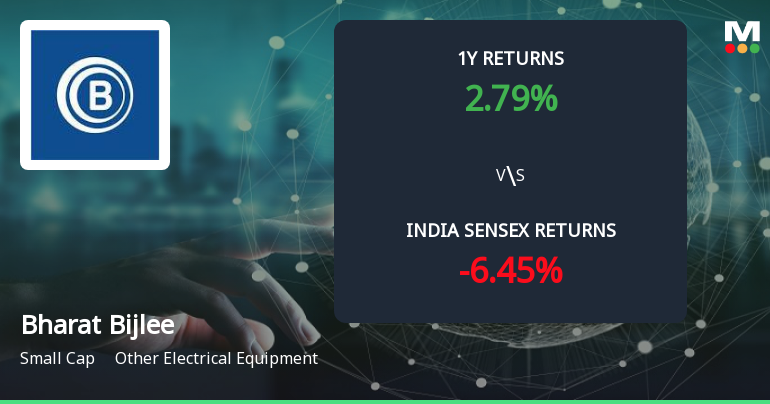
Bharat Bijlee Ltd Forms Golden Cross Amid Mixed Technical Signals and Strong Momentum
The 50-day moving average for Bharat Bijlee Ltd has crossed above the 200-day moving average, creating a golden cross on 22 Jun 2026. While this technical event often signals a shift towards bullish momentum, the broader technical and fundamental context presents a more nuanced picture that demands careful analysis.
Read full news article Announcements
Closure of Trading Window
25-Jun-2026 | Source : BSETrading Window Closure Notice
Board Meeting Intimation for The Approval And Adoption Of The Unaudited Financial Results Of The Company For The Quarter Ended June 30 2026.
25-Jun-2026 | Source : BSEBharat Bijlee Ltd-has informed BSE that the meeting of the Board of Directors of the Company is scheduled on 04/08/2026 inter alia to consider and approve the Unaudited Financial Results of the Company for the quarter ended June 30 2026.
Announcement under Regulation 30 (LODR)-Newspaper Publication
22-Jun-2026 | Source : BSENewspaper Publication - Advertisement for Transfer of Equity Shares to IEPF.
Corporate Actions

No Upcoming Board Meetings

Bharat Bijlee Ltd has declared 700% dividend, ex-date: 15 Jul 26

Bharat Bijlee Ltd has announced 5:10 stock split, ex-date: 24 Apr 24

No Bonus history available

No Rights history available
Quality key factors
Valuation key factors
Technicals key factors
 Technical Indicator Scale: Bearish, Mildly Bearish, Sideways, Mildly Bullish, Bullish Turned
 Shareholding Snapshot : Mar 2026
Shareholding Compare (%holding)
Non Institution
None
Held by 7 Schemes (11.33%)
Held by 63 FIIs (4.1%)
Danmet Chemicals Pvt Limited (8.14%)
General Insurance Corporation Of India (4.35%)
36.97%
Quarterly Results Snapshot (Standalone) - Mar'26 - QoQ

QoQ Growth in quarter ended Mar 2026 is 34.96% vs 20.05% in Dec 2025
QoQ Growth in quarter ended Mar 2026 is 59.24% vs -12.58% in Dec 2025
Half Yearly Results Snapshot (Standalone) - Sep'25
Growth in half year ended Sep 2025 is 22.05% vs -10.73% in Sep 2024
Growth in half year ended Sep 2025 is 31.34% vs -19.73% in Sep 2024
Nine Monthly Results Snapshot (Standalone) - Dec'25
YoY Growth in nine months ended Dec 2025 is 17.47% vs -0.19% in Dec 2024

YoY Growth in nine months ended Dec 2025 is -3.06% vs 0.52% in Dec 2024
Annual Results Snapshot (Standalone) - Mar'26
YoY Growth in year ended Mar 2026 is 19.57% vs 1.56% in Mar 2025
YoY Growth in year ended Mar 2026 is -10.15% vs 1.68% in Mar 2025
About Bharat Bijlee Ltd

Company Coordinates


